
AI-Ready Data standard explained
The users of data are expanding from people to AI. AI cannot verify facts that are not recorded.
So that agents use data
without guessing
The AI-Ready Data (AIRD) standard specifies two things. First, how to record, in a machine-readable format, the facts that AI needs to find, understand, trust and use data for a purpose. Second, how to judge that readiness state.
Agent judgments based on AIRD
The same example file, before and after applying AIRD: what an agent can know, as judged by this site’s measurement engine (experimental). Applying AIRD stage 1 means providing a data description in the standard format (a manifest) together with the file.
- 4 known
- 10 must guess
- 2 not covered by the standard
Out of 16 check items
- 12 known
- 2 must guess
- 2 not covered by the standard
Out of 16 check items
Values computed on the example file by this site’s measurement engine (experimental). The “16 check items” are the total of the items the engine checks for each of the four judgments (fitness · reliability · joinability · usability). How the 24 pieces of information agents need map to AIRD is shown in What agents read. Results by stage are in Walkthrough with example data.
Where to start, by role
Observations of public-sector data and enterprise data are in Why it is needed.
Case videos Under 2 minutes each
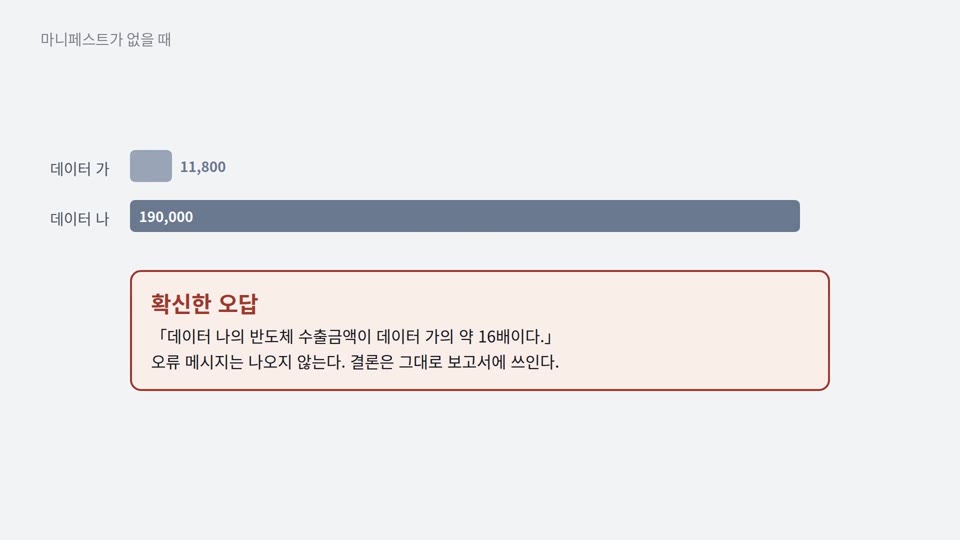 Joinability · Illustrative exampleSame name, different meaningIf differences in unit and period are not reflected, the result is 16 times the correct answer.
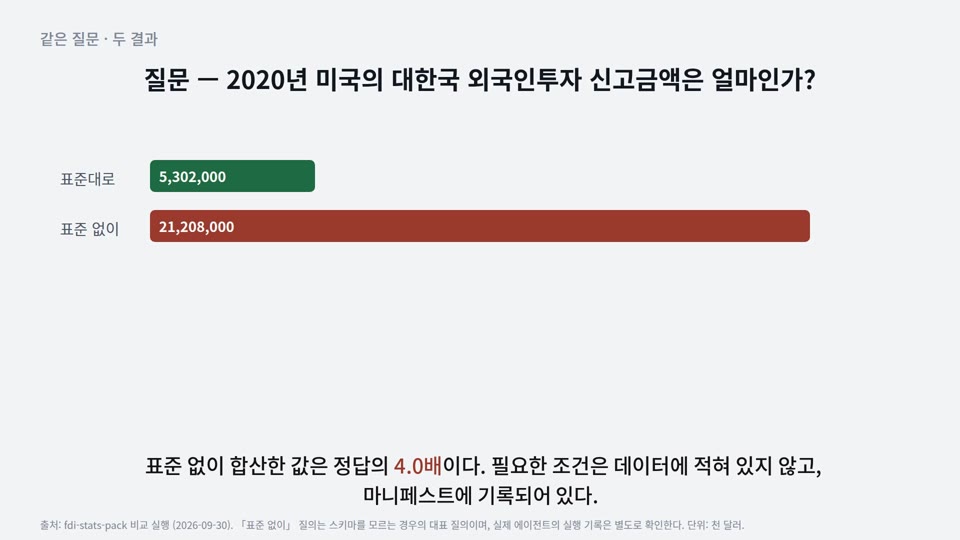 Reliability · Real dataThe same fact counted twiceIf duplicate reports, total rows and observation status are not distinguished, the sum is 4 times the correct answer.
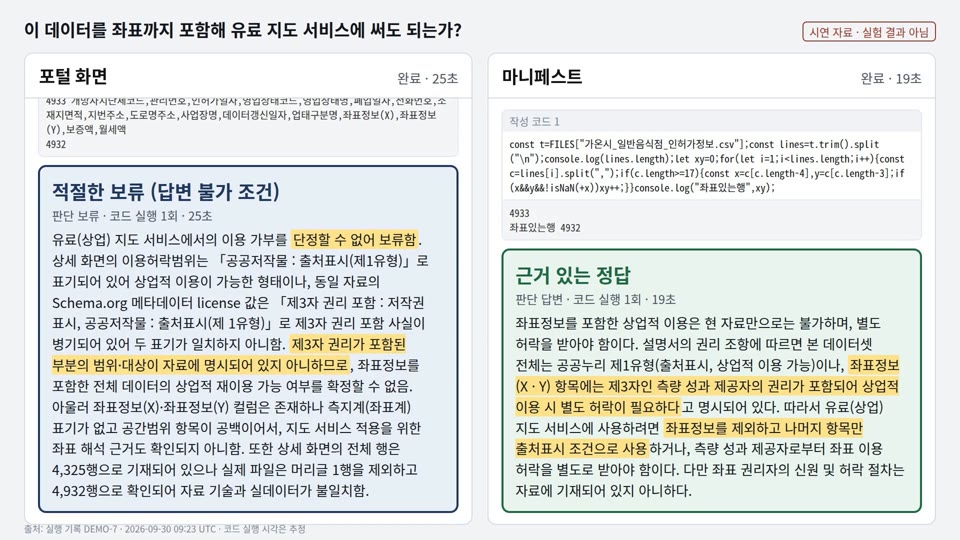 Usability · Run logJudging the permitted scope of useThe portal’s labels alone cannot establish the scope of third-party rights. The rights clause in the manifest states that scope.
What is AI-ready data
This page explains what AI-ready data is, the stages it goes through to be prepared, and what you can do now.
What you can do now
AI-ready data is data whose facts used by agents for judgment are recorded with the data in a machine-readable format, and that has reached the Quality-Ready state or higher. The abbreviation is AIRD, pronounced “air-d”. Data that has completed only stage 1 is Discoverable. [Part 1 3.1 · 5.1]
| Category | Items | Conditions |
|---|---|---|
| Possible now | Writing the stage 1 manifest · fixing defects · recording limitations · building an organization’s operating guideline | Can be done without a diagnostic tool or operating guideline |
| Requires an operating guideline | Diagnostic Maturity (DM) DM-1 · quality tier · transition to Quality-Ready or higher | The operating guideline provided with the standard is released at establishment (expected December 2026). Organizations can build and apply their own operating guideline |
| Follow-on parts (Parts 4–5)follow-on | Details of the decision gate judgment procedure · automated-use conditions | Outside the December 2026 establishment scope |
A transition to Quality-Ready requires a judgment that applies an operating guideline, so until then data can reach only Discoverable. How to build an operating guideline is in Building an operating guideline.
What changes
Agents guess facts that are not recorded with the data. The reasons and observations are in Why it is needed.
Four judgments before using data
The four judgments are the same for all data types. The information needed for them differs by data type. [Part 1 5.6]
| Data type | Main information needed for judgment (examples) |
|---|---|
Tabular · time series STRUCT TSERIES | Column meaning · units · code schemes · reference time · record key |
Text (documents) TEXT | Source · time of writing · unit of document splitting · evidence location · whether personal information is included |
Image IMAGE | Capture · collection conditions · label scheme · correspondence between label files and images |
Instruction–response pairs PT | Correspondence between instructions and responses · source · whether reviewed |
The current standard has the five data types above. Types such as video and audio may be added in the future.
Three stages
State names in the standard: Discoverable → Quality-Ready → Purpose-Ready
Completing only stage 1 already reduces the items an agent must guess. See examples in Case videos.
Files provided with the data
AI-ready data comes with documents that hold the facts needed for judgment, alongside the data files. The standard calls this distribution unit a pack. [Part 1 3.15 · 5.5] Pack composition · file formats · validation are in Packaging and distribution.
States · decision gates · tiers in detail
- What it means
- Data right after it is provided by the source. Data in this state is not AI-ready data.
- Verified layers
- None
- Quality tier
- —
- Purpose tier
- —
- Diagnostic Maturity
- —
- Relation to raw data
- Raw dataset
- What it means
- Contents and location are recorded, so the data can be searched and accessed.
- Verified layers
- Discovery
- Quality tier
- —
- Purpose tier
- —
- Diagnostic Maturity
- DM-0 · DM-1 · DM-2 if measured
- Relation to raw data
- Keeps the raw dataset’s values · converts only the format if needed
- Entry path
- Stage 1 — collection · conversion to an open format · writing the discovery layer
- G1 judges
- Completeness of the discovery layer
- Files proving the state
- manifest.json (discovery layer) · G1 judgment record
- What it means
- Quality is measured and judged with an operating guideline, and the transition conditions are met. From this state on, the data is AI-ready data.
- Verified layers
- Discovery · understanding
- Quality tier
- Tier 1 (Bronze) or higher
- Purpose tier
- —
- Diagnostic Maturity
- DM-2
- Relation to raw data
- Reflects cleaning results · same dataset as the raw data
- Entry path
- Stage 2 — measuring quality · fixing defects · writing the understanding layer
- G2 judges
- Whether a transition to Quality-Ready is possible (DM-2 · Tier 1 or higher · applying the operating guideline’s threshold profile)
- Files proving the state
- manifest.json (discovery · understanding layers) · diagnostic report · G2 judgment record
- What it means
- The quantitative requirements of a specific use purpose are also met.
- Verified layers
- Discovery · understanding · operation
- Quality tier
- Kept
- Purpose tier
- Assigned per purpose
- Diagnostic Maturity
- DM-2
- Relation to raw data
- Purpose-specific derivatives · exist alongside the raw data
- Entry path
- Stage 3 — purpose-specific conversion · writing the operation layer
- G3 judges
- Fulfillment of the purpose requirements
- Files proving the state
- manifest.json · diagnostic report · operation files (per purpose) · G3 judgment record
- What it means
- The checksum does not match or the recorded update frequency was not kept, so the assigned tiers are suspended. Passing revalidation returns the data to its previous state.
- Verified layers
- Previous state kept
- Quality tier
- Suspended
- Purpose tier
- Suspended
- Diagnostic Maturity
- Kept
- Relation to raw data
- Relation of the previous state kept
Frequently asked questions
- Is it mandatory?
- No. It is not an obligation under laws or regulations. Institutions and companies can cite this standard as a related standard in data management guidelines, project requirements or contract terms. Performing only stage 1 already reduces the items an agent must guess.
- What do we gain?
- Agents and users judge what the data is, whether it can be trusted and under what conditions it may be used, without asking the data provider. The manifest also records the grounds on which an agent selects the data as a search result or join candidate.
- Do we have to change the data?
- Stage 1 records descriptions without changing data values. Values are corrected when fixing defects in stage 2, and the original is preserved.
- How long does it take?
- The time depends on how complete the existing registration information and column descriptions are. Generating and entering metadata can be automated with tools; the data provider writes only the items not in the registration information.
Why it is needed
When people do not know something, they ask the data provider; agents instead guess the facts that are not recorded with the data. Observations of open data show this problem.
Observations of open data
We observed 84,271 file-data entries in the catalog of the Korea Public Data Portal (data.go.kr) (2026-08-31). In the catalog we found three values that block an agent’s judgment.
Source: observation of the Korea Public Data Portal catalog open-status listing (2026-08-31, 84,271 entries). Two DCAT files exported by the portal could not be read by an RDF parser.
For enterprise data, conditions of use are the first obstacle. We checked the terms of use of three Korean private-sector structured datasets; all three could be downloaded free of charge. However, all three restricted redistribution · automated collection through their own terms of use. None of the 14 license values in the vocabulary represents custom terms. The content of custom terms is written as text in rights (dct:rights), and how to record the license element is under review. People read the terms and judge, but an agent cannot confirm the conditions of use.
Cause of the problem
What is missing is not the data itself but the facts needed to use the data. Columns with the same name use different units, the same fact is reported several times, and the scope of the conditions of use is not written down. People fill in missing facts by asking the data provider. Agents cannot fill them in. See examples in Case videos.
What the standard does
- It has the facts agents use for judgment (meaning · unit · reference time · conditions of use) recorded in a machine-readable format in the manifest.
- It has quality measured with the same formulas, and the indicators measured and not measured recorded together.
- It specifies the tier system and judgment procedure. Threshold values are set by an operating guideline separate from the standard, and each tier must state the operating guideline applied.
- It has the grounds of each judgment recorded, so that an agent withholds rather than guesses when there is no evidence.
How to build an operating guideline is in Building an operating guideline.
Case videos
Four videos show how a manifest changes an agent’s judgments. The videos have no sound; the on-screen text carries the content, and captions (Korean · English) are available.
The demonstration videos were produced from run logs under the rules of an earlier version. The agents’ judgments do not depend on the measurement rules, but the manifest format shown in the videos differs from the current vocabulary.
The standard and operating guidelines
Contents
ContentsParts 1–3 of the standard contain the measurement methods · recording format · tier system; the operating guideline contains threshold values and operational matters; the vocabulary contains all metadata elements.
Structure of the standard
The standard has five parts. Building on the common concepts of Part 1, Part 2 covers measurement, Part 3 recording, Part 4 judgment and Part 5 use. Parts 1–3 are the draft standard (TTAK deliberation draft v0.95); Parts 4 and 5 are follow-on parts.follow-on
| Part | Standard title | Role | Governing document |
|---|---|---|---|
| Part 1 | AI-Ready Data - Part 1: Overview and framework | Overview and framework · terms · readiness states · data types · use purpose types | Draft standard |
| Part 2 | AI-Ready Data - Part 2: Quality measurement and tiering | Quality measurement · tiering · 16 indicators · Diagnostic Maturity (DM) | Draft standard |
| Part 3 | AI-Ready Data - Part 3: Dataset description schema and application profile | Dataset description schema · manifest element specification · application profile · controlled vocabularies | Draft standard |
| Part 4 | Follow-on part — title to be decided | Stage procedures · decision gates · purpose tier · history | Follow-on part — adopted in the standard discussions · outside the December 2026 establishment scope |
| Part 5 | Follow-on part — title to be decided | Discovery · exchange · agent use · user feedback | Follow-on part — adopted in the standard discussions · outside the December 2026 establishment scope |
Work on Parts 1–3 began on March 9, 2026, and they were proposed to TTA (Telecommunications Technology Association) as a standard on May 13, 2026. The review is in progress at TTA regular meetings. Progress is described in Origins and progress.
Specification documents
Requirements are set by the specification documents. This site links to the specification instead of reproducing it. Where the explanation and the specification differ, the specification prevails. Links to the specification documents will be added at establishment.
Markers such as [Part 2 8.1] on this site refer to clauses of the specification. When the specification documents will be published is in Development status and upcoming releases.
Operating guidelines
Judgment criteria are set by an operating guideline separate from the standard. Tier elements follow the standard; operational elements are set by the operating guideline.
| Category | Responsible document | Contents |
|---|---|---|
| Tier elements | Standard | Tier system Tier 0–4 · tier names · notation format · judgment procedure |
| Operational elements — threshold profile | Operating guideline | For example: tier bands · required pass line per dimension · dimension weights · lower bound of DM-1 evaluation coverage [Part 2 Annex D] |
| Operational elements — operational matters | Operating guideline | Diagnosis cycle · validity period of results · appeal procedure · tool certification [Part 1 7.1] |
The threshold profile is part of the operating guideline. Organizations · institutions · domains can build operating guidelines independently. There is therefore more than one guideline publisher.
Whoever judges and publishes a tier must explicitly provide the operating guideline applied and make it publicly accessible to anyone. A tier is stated together with the operating guideline’s identifier · version. A result without an applied operating guideline is not given a tier and is recorded as “Not judged: no operating guideline applied”.
The operating guideline provided with the standard is released at establishment (expected December 2026). The structure of an operating guideline and the threshold profile items are in Building an operating guideline.
The standard and the vocabulary
The names · value ranges · obligation levels of metadata elements are given in the “AIRD vocabulary (v0.10.5)”. The deliberation draft and the vocabulary agree. The deliberation draft focuses on required elements; the vocabulary gives the complete list, including external vocabularies.
This site uses the 23 required discovery-layer metadata elements of the vocabulary’s demo profile. The list of elements is in Metadata elements.
Site menus and parts
| Menu | Main parts explained |
|---|---|
| About the standard | Part 1 |
| Preparing data | Parts 1 · 2 · 3 |
| For agents | Part 3 (automated-use conditions in Part 5follow-on) |
| Operating guidelines | Part 1 7.1 · Part 2 Annex D |
| Concepts and judgment | Parts 1 · 2 · 3 (details of decision gate judgment in Part 4follow-on) |
| Reference | Parts 1 · 2 · 3 |
Types of references
External documents cited by the specification are divided into normative references, which are part of the conformance obligations, and a bibliography, which aids understanding. Both lists are in the specification documents.
Origins and progress
This page lists, in date order, when the key decisions of the standard were made and which problems prompted them. The 2025 entries carry over only the concepts from material written and proposed by Haklae Kim (HIKE Lab, Chung-Ang University), and note how the current standard differs. The proposals of that time are not the current standard.
Defining the problem August–September 2025
2025-08 · Standards cover only metadata, not data values
The analysis split data into three layers: data values (Level 0), dataset metadata (Level 1), and service-level data (Level 2). International metadata standards apply to Level 1. Data values have no standard, which was judged to make linking data difficult.
Now The standard covers both the record (Part 3) and quality measurement of data values (Part 2) — Quality indicators
2025-08 · From human-centered use to joint use by people and AI
The proposal drew the preparation process from data provision to AI use as six steps — cleansing · structuring · lineage · bias reduction · integration · accessibility — and fed the results of preparation back into the provider’s quality management.
Now Preparation has three stages — writing the manifest · measuring quality · preparing for a purpose — and each stage has a decision gate and outputs — What is AI-ready data
2025-08 · Proposed definition and maturity levels
The proposal defined AI-ready data as “data that AI can train on, reason over and use without further cleansing,” and proposed maturity levels rising from quality → training → generative AI → reasoning, with draft evaluation indicators for each level.
Now The standard has no single maturity scale. It judges Diagnostic Maturity, quality tier and purpose tier separately and does not combine them — Judgment procedure
2025-09 · Current data compared with AI-ready data
The comparison used five axes: delivery format · quality management · quality criteria · intended users · portal functions.
| Axis | “Current data” as described in 2025 | “AI-ready data” as described in 2025 | Now |
|---|---|---|---|
| Delivery format | CSV · Excel · API | JSON · Parquet · RDF · API | Manifest and quality evidence take priority over format |
| Quality management | Metadata and some rules | All data values and semantic quality | Metadata recording and data value measurement in parallel |
| Quality criteria | No clear indicators | Managed indicators for accuracy · completeness · consistency | The standard sets measurement methods and the tier system; the operating guideline sets the threshold values |
| Intended users | Human-centered | Joint use by people and AI | Whether an agent can make judgments from the record alone |
| Portal functions | Mainly search · download | AI-oriented, such as Q&A and recommendation APIs | Outside the scope of the standard — the standard covers data and its record |
Numeric thresholds in the proposal of that time are not carried over. The standard does not set numeric thresholds. They are set by the threshold profile of the operating guideline.
Refining the definition October 2025
2025-10 · Structure · semantics · trust information
The definition was refined to “data prepared with machine-readable structure, semantics such as standard codes and relationship information, and trust information such as provenance, version and bias, so that AI can use it directly for training, reasoning and generation.”
Now Made concrete as metadata elements and the discovery and understanding layers of the AIRD vocabulary (v0.10.5) — Metadata elements
2025-10 · From format-centered quality to semantic and value-centered quality
The proposal went beyond format checks such as date formats and missing values. It included the use of standard codes and the meaning of values in the scope of quality, and proposed alignment with international criteria (for example ISO/IEC 5259).
Now 16 quality indicators and their correspondence with other standards — Quality indicators
Turning toward a standard November 2025
2025-11-03 · From guideline items to a standard vocabulary
A metadata proposal made elements that directly support AI use (quality score · bias information · missing-value policy · preparation stage) required and administrative elements optional. It recommended three follow-up tasks.
| November 2025 recommendation | Current standard · site |
|---|---|
| ① Refine the metadata specification and validation rules (valid values · format validation) | Metadata elements · Judgment procedure |
| ② Design an application model for domestic and international standard vocabularies (for example ISO/IEC 5259 · DCAT-AP-KR) | vocabulary v0.10.5 |
| ③ Develop a metadata vocabulary shared across domains | A scope that applies to any publisher · What is AI-ready data |
Standardization and public tools November 2025 onward
2026-03-09 · Drafting of Parts 1–3 of the AI-Ready Data draft standard begins
Drafting began on “AI-Ready Data – Part 1: Overview and framework,” “Part 2: Quality measurement and tiering” and “Part 3: Dataset description schema and application profile.” Judgment (Part 4) and use (Part 5) follow as follow-on parts.
Now Draft standard (TTAK deliberation draft v0.95), scope of establishment in December 2026 — The standard and operating guidelines
2026-04-14 · Standard development tools released
While developing the standard, the implementation toolkit (aird-tools) was published in a public repository.
Now Available tools and their status — Public tools
2026-05-13 · Proposed to TTA as a standard
Parts 1–3 were proposed to TTA (Telecommunications Technology Association) as a standard. Review has continued at TTA regular meetings since then.
Now Under review — The standard and operating guidelines
2026-08-03 · An MCP server that applies the draft standard
An MCP server (Public Data Lens) was released. It applies part of the draft standard’s judgments, as versioned rules, to the catalog metadata of the Korea Public Data Portal (data.go.kr).
Now Available tools and their status — Public tools
2026-09-30 · AIRD vocabulary v0.10.5
The names, value ranges and obligation levels of metadata elements were fixed in the vocabulary.
Now The reference vocabulary of this site — Metadata elements
2026-10 · Applies to any publisher
The policy of not limiting the standard’s scope and users to public-sector data was applied across the site. This follows the direction of November 2025 recommendation ③ (a vocabulary shared across domains).
Now Data from public institutions, enterprises and non-profits is handled with the same procedure — What is AI-ready data
Development status and upcoming releases
This page collects materials and tools in preparation, with their main users and current status.
The site’s menus and body text include only what is available now. The status chips in the table “Materials in preparation” are explained in the table “What each status means.”
Materials in preparation
| Item | Contents | Main users | Status |
|---|---|---|---|
| Schema and context | Manifest JSON Schema · JSON-LD @context · SHACL shapes · changes by version | Agent and AI developers (data users) | In development |
| Validation tools and APIs | Manifest validator · quality evaluator · conversion pipeline · verified facts lookup API | Agent and AI developers (data users) | Under review |
| Release version of the diagnostic tool | A command-line diagnostic tool that uses the same judgment rules as this site’s measurement engine, with example input | Data providers | In development |
| Single-document guide | PDF · docx with the same content as the “Preparing data” menu — generated from the same source as the site | Data providers | In development |
| Figure source files | SVG · PNG of the site’s figures | All readers | Under review |
| Links to the specification documents | Addresses of the Part 1–3 specification documents · links from clause citations to the specification of that part | All readers | Release pending |
| Procurement and contract requirements | Model wording and cases for organizations that buy or procure data to include AI-ready data requirements in contract and procurement terms | Organizations that buy or procure data | Under review |
What each status means
| Status | Meaning |
|---|---|
| Under review | Deciding the scope and form of release |
| In development | Being developed. Release date not set |
| Release pending | Content is ready. Waiting for the release condition (establishment of the standard or opening of a distribution channel) |
When a material is released, it is added to the menu it belongs to.
Preparing data › Procedure
Overview
Contents
ContentsThis is a map of the procedure that checks the data you hold and, through three stages, brings it to a state AI can use. Data judged Quality-Ready or higher under an operating guideline is distributed as a pack; before that, you publish the manifest.
Scope — For tabular (STRUCT) and time series (TSERIES) data, this guide goes down to concrete action items. Text (TEXT) · image (IMAGE) · instruction–response pair (PT) data follow the same procedure. Items specific to each type will be added in later versions.
Stages and outputs
Data starts in a raw state, and its readiness state rises through three stages. Each stage ends at a decision gate. AI-ready data means a state of Quality-Ready or higher. [Part 1 3.1 · 5.1]
| Stage | What you do | Outputs (file · format) | State reached | Needed for the judgment |
|---|---|---|---|---|
| Checking your data | Check data type · character encoding · presence of personal information | Check record | Raw | — |
| Stage 1 Writing the manifest | Write metadata elements · write the column schema · choose persistent identifiers | Manifest manifest.json — JSON-LD, discovery layer · column schema | Discoverable | Required discovery-layer metadata elements met |
| Stage 2 Measuring quality · fixing defects | Measure quality indicators · fix defects · record limitations | Diagnostic report — JSON · cleaned data · processing history · limitation record · understanding layer of the manifest | Quality-Ready | Threshold profile of the operating guideline · Diagnostic Maturity (DM) DM-2 · quality tier Tier 1 or higher |
| Stage 3 Preparing for a purpose | Write operation files tailored to the use purpose | Purpose-specific operation file — one per purpose type | Purpose-Ready | Purpose profile registered |
| Distribution | Assemble and distribute the pack | Pack — manifest · diagnostic report · pack manifest · operation files. Data files are referenced by address · checksum | — | — |
A new manifest is issued for each version and points to the previous version. The tier judgment procedure is in Judgment procedure; pack contents and file formats are in Packaging and distribution.
Working principles
- Follow the stage order. Make the data discoverable before you measure its quality.
- Complete what is not met. If data does not pass a decision gate, complete the unmet items and check again. Not meeting a gate does not mean rejection.
- Keep the original. Cleaned data and purpose-specific outputs are kept alongside the original.
- You can split the work by stage. Stage 1 alone reduces the items an agent must guess.
What you can do now
| Category | Work |
|---|---|
| A data provider can do alone | Checking the data · writing the manifest (23 metadata elements · column schema) · computing checksums. Choose persistent identifiers after checking your organization’s identifier policy |
| Needs a diagnostic tool | Measuring quality · writing the diagnostic report. The release version of the diagnostic tool is in development (Development status and upcoming releases) |
| Needs an operating guideline | Quality tier judgment · Quality-Ready transition judgment. The operating guideline provided with the standard is to be released when the standard is established (expected December 2026); organizations can judge with their own operating guideline |
Details are in What is AI-ready data — What you can do now.
Five-question self-check of your current state
For data that is already open, the five-question self-check decides your starting stage. Depending on your answers, you start at writing the manifest (stage 1) or measuring quality (stage 2).
Judgment rule — the first “No” decides the starting point. An answer to a later question counts only after the conditions of earlier questions are met. Even if a later question is “Yes,” the starting point follows the first “No.”
The numbers in the “Choosing the starting point” table are the numbers of the five questions in the self-check above.
Choosing the starting point
| First “No” | Starting point | Reason |
|---|---|---|
| Question 1 or 2 | Writing the manifest (stage 1) | Without an open format and column descriptions, quality cannot be measured |
| Question 3 or 4 | Writing metadata elements in Writing the manifest (stage 1) | These correspond to fields on the registration screen |
| Question 5 | Measuring quality (stage 2) | Recording limitations is stage 2 work |
| None (all “Yes”) | Measuring quality (stage 2) | Meeting the metadata elements and measuring quality are separate |
The number of “No” answers does not indicate errors by the data provider. Existing portal registration screens had no input field for some of the 23 metadata elements and did not support delivery in machine-readable formats.
Materials to gather before you start
Before starting, the data provider gathers the following materials. If a material is missing, start with the metadata elements you can fill in.
| Material | Where to find it | If missing |
|---|---|---|
| Data files | The system in charge · portal registrations · internal data catalog | Start with the description work in stage 1 |
| Current registration information | Public-sector data: portal registration screen · enterprise data: internal catalog or data exchange product listing | Write it from scratch |
| Column descriptions | Column comments in the source database | Write them in Writing the manifest (stage 1) |
| Update frequency | Actual update history | Check the actual frequency first |
| Conditions of use | Public-sector data: the institution’s open data policy · enterprise data: terms of use · license documents (with effective date) | Ask the responsible department |
Before and after preparation
Before and after preparation — expand 7-row table
| Item | Before | After |
|---|---|---|
| Column meaning | Column names only | Name · data type · description · code values |
| Update frequency | “As needed” | URI from a standard list (e.g. …/frequency/IRREG) |
| Conditions of use | “Includes third-party rights: N” | License value from the vocabulary (e.g. KOGL-1) |
| File information | None | Access URL · media type · file format · checksum |
| Quality | Unknown | Scores for 7 dimensions + Diagnostic Maturity + evidence |
| Limitations | None | Bias · unsuitable uses · causes of missing values |
| History | None | What was changed · date · reason |
Stage 1 does not change data values. Stage 1 adds information that describes the meaning, format and source of the values. Fixing defects in stage 2 can change values. The data provider records what was fixed, how and why in the processing history. Stage-by-stage results for an example file are in Walkthrough with example data.
Labels used on this site
| Label | Meaning |
|---|---|
| Required | Required by the current draft standard |
| Standard | Set by the operating guideline (threshold profile) |
| Recommended | Recommended by this site for convenience. Not a requirement of the draft standard |
| Example | A value or wording for illustration |
Recommended items are not requirements of the draft standard, so you can decide differently to suit your organization.
The mapping between these labels and shall · should · may in the specification text is not yet final.
Done when
- You have answered the five-question self-check and decided your starting stage (stage 1 or stage 2).
- You have checked whether you have each of the five materials in the “Materials to gather before you start” table.
Preparing data › Procedure
Checking your data
Contents
ContentsBefore starting stage 1, check the data type, character encoding and presence of personal information in the files you hold.
Determining the data type
The data provider decides the data type first. The measured items and metadata elements depend on the type. [Part 1 5.6 Table 5-5] Required
| Type | Definition | Examples | Standard identifier |
|---|---|---|---|
| Tabular | Data with rows and columns, where each column has a defined data type | Business registration status · permit lists · transaction records · product master data | STRUCT |
| Time series | Data that records values in time order. A special case of tabular data | Equipment sensor readings · daily prices | TSERIES |
| Text | Data made of natural-language sentences and documents | Answers to civil complaints · original texts of public notices · reports · manufacturing technical documents | TEXT |
| Image | Image files such as photos and drawings | Facility inspection photos · satellite imagery · product defect inspection images | IMAGE |
| Instruction–response pairs | Text data made of instruction–response pairs or preference pairs | Customer inquiry question–answer pairs | PT |
Data of multiple types Required
The data provider picks one representative type for the overall label. If a file or component falls under several types, apply the check items of each type to each component. Choosing a representative type does not mean skipping the check items of the other types. [Part 2 8.2]
Time series is a special case of tabular data. Apply the tabular check items to time series data as they are, and also record the reference time · measurement interval · unit. Recommended
What depends on the type
The data type determines the following three things.
| Item | Meaning | Count by type | Basis |
|---|---|---|---|
| Indicators that must be measured (required formal indicators) | The set of indicators the standard specifies for each data type. Diagnostic Maturity (DM) reaches DM-2 only when every indicator in the set is measured | Of the 16 quality indicators: STRUCT 13 · TSERIES 13 · TEXT 5 · PT 8 · IMAGE 3 | [Part 2 Annex A.2] |
| Minimum measurable indicators (MMI) | Indicators that must be measured at a minimum for any type. The lower-bound condition for the Diagnostic Maturity judgment | 4 — D5-03 (Statistical plausibility) · D6-01 (Uniqueness) · D7-01 (Encoding consistency) · D7-02 (Technical validity). Only the indicators that apply to the type are measured | [Part 2 Annex A.1] |
| Additional metadata elements | Elements added to the manifest depending on the type | See Metadata elements | [Part 3] |
Required formal indicators define “how much must be measured to be complete.” Minimum measurable indicators define “what must be measured at the very least.” The rules that determine Diagnostic Maturity are in Judgment procedure; the definition of each indicator is in Quality indicators. Action items for text · image · instruction–response pair data will be included in a later version after they are checked against the text of the standard.
Without reference data to compare against, accuracy cannot be measured. The diagnostic tool marks this state as “accuracy not measured.” “Accuracy not measured” is a measurement status, not a penalty. If an accuracy indicator is a required formal indicator for that type, Diagnostic Maturity does not reach DM-2. In that case the move to the next readiness state (transition), that is, the transition to Quality-Ready, does not take place. [Part 2 7.4 · 8.1] Required
Checking character encoding
The reference encoding is UTF-8. CP949 · EUC-KR are not the reference encoding and are judged non-conforming. Encoding is measured by the minimum measurable indicator D7-01 (Encoding consistency). [Part 2 Annex A.4] The data provider can check and fix the encoding directly.
- Check with an editor. Open the file in a text editor and read the encoding indicator (status bar or the “Save As” dialog). The result is the name of the encoding.
- Check with a command. In a terminal, run
file -i <file>(Linux) orfile -I <file>(macOS). If the result containscharset=utf-8, the file is UTF-8.charset=us-asciimeans the file contains only English letters and digits and can be read as UTF-8. - Convert if it is not UTF-8. Save it again as UTF-8 in the editor, or run
iconv -f CP949 -t UTF-8 <source> > <converted>. The result is a UTF-8 file. - Record the result. Write down the encoding you checked together with the data type.
If your organization specifies a different encoding rule, the data provider follows it and records the applied rule in the manifest. Whether a byte order mark (BOM) is present and differences in line-break characters are not measured, so no action is needed.
Data that contains personal information
References: “Pseudonymized Information Processing Guidelines” (revised March 2026) of the Personal Information Protection Commission (PIPC, Korea’s data protection authority). Public institutions also check the “Public AX Privacy Guide” (July 2026). The latest versions are in the PIPC resource library.
A dataset that contains personal information must state whether it has been de-identified. [Part 3 Annex A.1] Required The level, method and date of processing are recorded in stage 2.
This procedure covers public provision. Data with restricted release is not covered by this procedure. Whether such data can be prepared in a controlled environment is judged separately by the organization.
Done when
- You have decided and recorded the data type (one or more of STRUCT · TSERIES · TEXT · IMAGE · PT).
- You have checked and recorded whether the character encoding is UTF-8.
- You have checked whether the data contains personal information.
Preparing data › Procedure
Writing the manifest (stage 1)
Contents
ContentsIn stage 1 you fill in the 23 discovery-layer metadata elements and the column schema to create the manifest manifest.json (JSON-LD). The manifest is the basis on which the data reaches the Discoverable state.
Stage 1 checklist — 23 metadata elements (demo profile)
0 / 23 filled
Dataset
Distribution (per file)
Checkbox states are saved only in this browser. Source: AIRD vocabulary v0.10.5 demo profile.
Stage overview
The goal of stage 1 is to record, in machine-readable form, what the data is and where it is. The data provider can complete stage 1 using the guidance in the current version alone. For persistent identifiers, use the interim rules in Choosing persistent identifiers.
| Task | Output |
|---|---|
| Convert proprietary formats to open formats | Open-format files (e.g., CSV · JSON) |
| Fill in metadata elements | Manifest manifest.json — JSON-LD, discovery layer |
| Record the meaning of each column | Column schema (csvw:tableSchema) — included in the manifest |
A full manifest example is in Manifest example, and the structure of the pack that contains the manifest is in Packaging and distribution. A new manifest is published for each version and points to the previous version.
Stage 1 does not change data values. The data provider keeps the content of the data and adds descriptions. [Part 1 5.2]
Who does what
| The data provider alone | The diagnostic tool | The organization decides |
|---|---|---|
Filling in metadata elements · writing the column schema · converting to open formats · writing the manifest · calculating checksums (sha256sum) | Calculating checksums · generating a manifest draft | Persistent identifier issuance policy · license and rights · disclosure scope of personal information |
The data provider can calculate checksums directly: run sha256sum <file> on Linux or shasum -a 256 <file> on macOS. The diagnostic tool also calculates checksums from the files. The data provider can write the manifest directly or revise a draft generated by the diagnostic tool.
At decision gate ①, the data provider and the diagnostic tool check whether the required metadata elements are met. [Part 4 6.4]follow-on part Elements not met are completed and checked again.
Judgments stage 1 supports
The work in stage 1 supports finding data, accessing it, and checking the conditions of use. The identifier lets other resources refer to the data. Column descriptions convey the meaning of values. The rights statement is the basis for judging whether the data may be used. The data provider can complete stage 1 without knowing the FAIR principles.
Elements to check
There are 23 metadata elements (19 for the dataset + 4 for each distribution). This site uses the 23 elements of the AIRD vocabulary v0.10.5 demo profile. The deliberation draft requires 19 (15 for the dataset + 4 for each distribution). The demo profile adds 4: dataset structure type, theme, landing page, and maintaining department. Theme and landing page are required for public-sector data and recommended otherwise. [Part 3 Annex A.1]
The 4 distribution elements apply to each distributed file. With 3 files there are 19 + 4 × 3 = 31 values. The full list and judgment criteria are in Metadata elements.
The 6 elements most often missing or recorded incorrectly are:
| Element | Level | Criterion | Common problem |
|---|---|---|---|
| Persistent identifier | Required | A permanent identifying value that does not change. A resolvable URI is the principle. Distinct from the access URL | Using an internal organization number as is |
| Keyword | Required | 3 or more | Only 1–2 recorded |
| Update frequency | Required | Recorded as a URI from the standard list | Free text such as “quarterly” or “as needed” |
| License | Required | Choose from the 14 values of vocabulary kr-license (e.g., KOGL-0~4 · KOGL-AI · CC). How to record a license not on the list is under review | “Yes / No” or a long sentence |
| Media type | Required | IANA notation such as text/csv | “Text” · “Image” |
| Checksum | Required | A SHA-256 value for each distribution | Missing |
The persistent identifier and the access URL are different. The persistent identifier identifies the dataset. The access URL is where the actual data is accessed. The data provider does not fill both elements with the same value. If the organization has no identifier issuance policy, apply the interim rules in Choosing persistent identifiers.
If there are several files, create several distributions. When tables, images, and videos are provided together, record the access URL, media type, file format, and checksum separately for each distribution.
A column schema is required for tabular data. The column schema is either written directly into the manifest or kept as a separate document that the manifest points to by address and hash. How to write it is in the “Writing the column schema” section, and the judgment criteria are in Metadata elements.
Writing the column schema
The column schema (csvw:tableSchema) is a table that records the name, data type, and meaning of each column. Without a column schema, the meaning of data values is hard to determine.
Why it is needed
Column descriptions in the source database can be lost when the data is exported to CSV. If only the column names remain, the meaning of a name like mkt_nm is hard to determine. Stage 2 quality measurement also uses the column schema as input.
Elements per column
Elements per column — expand the 11-row table
| Element | Level | Example | Stage 2 indicator that needs this element |
|---|---|---|---|
| Name (column name) | Required | bizr_no | — |
| Data type | Required | String | — |
| Description | Required | Business registration number issued by the National Tax Service. No hyphens | — |
| Required flag | Required | Required (value must not be empty) | D1-01 (Required field completeness) |
| Value range | Recommended | employeeCount from 0 to 100000 | D5-02 (Numeric range validity) |
| Inter-field relationship | Recommended | Example If the closure flag is 1, a closure date exists | D2-01 (Inter-field consistency) |
| Derivation rule | Recommended | Example Total = number of men + number of women | D2-03 (Derived value accuracy) |
| Code list and its edition | Recommended | Korean Standard Industrial Classification (revision stated) · code value meanings 01=operating, 02=suspended, 03=closed | D2-02 (Referential integrity) |
| Display name | Recommended | Business registration number | — |
| Unit | Recommended | KRW · ㎡ · ℃ | — |
| Empty value notation | Recommended | Blank | — |
Recommended elements are inputs to stage 2 measurement. If the column schema lacks the required flag, value range, inter-field relationships, derivation rules, or code list and its edition, the diagnostic tool cannot measure D1-01 · D5-02 · D2-01 · D2-03 · D2-02 in stage 2. Indicators that could not be measured are recorded in the diagnostic report together with the reason they were not measured (Reading the diagnostic report (stage 2)).
Empty value notation is not a requirement of the standard, but it often causes problems in practice. If blanks,
-,N/A, and0are mixed, you cannot tell whether 0 is a real value or an empty one.
Choosing file formats Recommended
| Situation | Recommended | Reason |
|---|---|---|
| Tabular | CSV (UTF-8) | Readable by general-purpose tools |
| Tabular · large volume | Parquet in addition | Faster download and processing |
| Data with a hierarchical structure | JSON | Flattening into a table loses hierarchical relationships |
| Geographic information | GeoJSON | Includes the coordinate reference system |
| Documents | Original format + extracted text | The original alone is not machine-readable |
| Images | Standard image formats | Proprietary formats cannot be read by general-purpose tools |
The reference encoding is UTF-8. How to check the encoding is in Checking your data.
Formats to avoid
- Providing only formats that open in one specific program
- Tables with merged cells, subtotal rows, or multi-line headers
- Files that split several tables across sheets without explanation
Image labels (ground truth), training and validation splits, the correspondence within instruction–response pairs, and document chunking units are not stage 1 requirements. Photos without labels can also become “Discoverable” data.
Examples and common errors
Example
Before
Title: Data
Description: Related data.
Update frequency: as needed
License: Includes third-party rights - N
Media type: text
Column schema: (none)
After
Title: Business registrations in ○○ City, 2025
Description: Industry, location, and business status of businesses registered in ○○ City.
      As of 2025-12-31, 12,480 records.
Keywords: business, permits, industry, ○○ City
Data type: STRUCT
Update frequency: http://publications.europa.eu/resource/authority/frequency/IRREG
License: KOGL-1  (vocabulary kr-license value)
Rights: KOGL Type 1. Free to use with source attribution. (notice)
Media type: text/csv
Access rights: PUBLIC
Column schema: name, data type, description, required flag, and code values recorded for all 14 columns
Common errors
The three most common errors in stage 1 are listed below.
| Wrong | Corrected | Cause of the problem |
|---|---|---|
| Free text such as “quarterly” or “as needed” in update frequency | Recorded as a URI from the standard list — “quarterly” as …/frequency/QUARTERLY, “as needed” as …/frequency/IRREG | Update frequency is chosen from a standard list. Machines cannot interpret free text |
| “Includes third-party rights: N” recorded in rights | Choose from the license value list (vocabulary kr-license) (e.g., KOGL-1). Record a notice of the permitted scope of use in rights | It is unclear what is permitted |
| Manifest copied from other data without correcting the access URL | Change the access URL in the copied manifest to this data’s address | The format is valid but it points to the wrong location. A defect that format checks do not detect |
Completion criteria
- All 23 metadata elements in the “Stage 1 checklist” are filled in.
- The column schema records the name, data type, description, and required flag for every column.
- The persistent identifier is decided (Choosing persistent identifiers).
Preparing data › Procedure
Choosing persistent identifiers
Contents
ContentsHow to give a dataset a persistent identifier that does not change. Check your organization’s identifier policy first; if there is none, follow the interim rules.
What the standard requires — a persistent identifier in URI form. A resolvable URI is the principle. [Part 3 Annex A.1] Required
If your organization (public institution, company, or association) has an issuance policy, that policy takes precedence. This page gives interim rules to use until a policy is in place. Recommended
Deciding on a persistent identifier
| Situation | Decision |
|---|---|
| Organization has an issuance policy | Apply the organization’s policy (takes precedence over the interim rules) |
| No policy · organization has a domain | 1st choice · set a fixed path under the organization’s domain — https://data.<org-domain>/id/dataset/<name> |
| No policy · no organization domain | 2nd choice · check whether a parent organization (the supervising body of a public institution, or a company’s group) or a shared namespace can be used |
| No policy, domain, or shared namespace | Assign an identifier whose uniqueness is guaranteed · record the fact that it does not resolve as a limitation |
Never leave the identifier blank. Without an identifier, the dataset does not pass the stage 1 check.
Construction rules
An identifier has two parts: namespace + dataset name.
https://data.<org-domain>/id/dataset/<dataset-name>
└─────────── namespace ───────────┘└─ dataset name ─┘
fixed area the organization controls never changed once set| Part | Include | Exclude |
|---|---|---|
| Namespace | A fixed address representing the organization | Department name — changes on reorganization |
| Dataset name | A fixed name for the dataset · a meaningless serial number is also allowed | Version · year — change on update File format — invalid when the format changes Portal listing key — changes when re-registered on the portal |
Key rule: do not put anything that changes into the identifier. The data provider records version, reference time, and format in separate elements: version in dcat:version, reference time in the temporal coverage, and format in dct:format.
Examples
The example identifier on this site is https://data.example.go.kr/id/dataset/biz-registry.
Examples — expand the 8-row table
| Judgment | Value | Reason |
|---|---|---|
| Suitable | https://data.example.go.kr/id/dataset/biz-registry | Fixed namespace · unchanging name |
| Suitable | https://data.example.go.kr/id/dataset/d-00417 | A meaningless serial number is also allowed |
| Suitable | https://data.example.com/id/dataset/sales-daily | Fixed path under a company domain · unchanging name |
| Unsuitable | https://data.example.go.kr/file/biz_2025_v3.csv | Contains year, version, and format. Record the file address as the access URL (dcat:accessURL) |
| Unsuitable | BIZ-2025-001 | Not a URI · contains a year |
| Unsuitable | 15029008 | Portal listing key · changes when re-registered on the portal |
| Unsuitable | https://www.data.go.kr/data/15029008/fileData.do | Portal detail page address · changes on re-registration. Record it as the landing page (dcat:landingPage) |
| Unsuitable | https://market.example.com/products/48213 | Data marketplace product page address · changes when the product is re-registered. Record it as the landing page (dcat:landingPage) |
Do not use the portal listing key or the portal detail page address as the persistent identifier. Both values change when the data is re-registered on the portal. The same applies to a data marketplace’s product page address.
Record the portal detail page address as the landing page (
dcat:landingPage). Record the file download address as the access URL (dcat:accessURL). The persistent identifier, landing page, and access URL are different values.
Keeping identifiers stable once assigned
| Situation | Identifier handling |
|---|---|
| Values cleaned | Keep — same dataset |
| New version published | Keep — versions are distinguished by version number |
| File format added | Keep — a distribution is added |
| Purpose-specific operation file created | Keep — use the source dataset’s identifier |
| Portal re-registration · migration | Keep — update only the landing page and access URL |
| Datasets merged · split | Assign a new one — a different dataset |
The purpose of an identifier is not to change. Changing an identifier breaks every reference that pointed to the data.
Points to confirm with the responsible department
When requesting a policy, the data provider passes on the following points.
| Point to confirm | Purpose |
|---|---|
| Whether the organization controls a domain | Deciding the namespace |
| Whether the domain’s retention period is guaranteed | Ensuring identifier persistence |
| Whether an existing dataset numbering scheme exists | Reflecting the existing numbering scheme in the URI path |
| Who manages identifier issuance and retirement | Preventing duplicate issuance |
The rules on this page are interim rules. Once an organizational policy or higher-level guideline is in place, that policy or guideline takes precedence. Identifiers already assigned are kept.
Completion criteria
- The “dataset identifier” is in URI form.
- The identifier contains no year, version, file format, department name, or portal listing key.
- The identifier, landing page, and access URL are different values.
Preparing data › Procedure
Measuring quality (stage 2)
Contents
ContentsIn stage 2, quality measurement, the data provider prepares the material needed for measurement, and the diagnostic tool measures the indicators and produces the diagnostic report.
GoalHave the material needed for measurement ready, and check the scores and Diagnostic Maturity (DM) in the diagnostic report produced by the diagnostic tool.
What happens in this stage
The diagnostic tool computes indicator scores and Diagnostic Maturity even without an operating guideline. How many indicators are measured depends on the data type and the material the data provider has. For the tabular (STRUCT) example file, the file alone allows 6 of the 13 required indicators to be measured. With the stage 1 manifest filled in, 7 of the 13 are measured. The remaining indicators need external material (for example, code tables or a reference time). Results by step are in Walkthrough with example data.
The quality tier is judged with the threshold profile of an operating guideline.
The goal of stage 2 is to measure the quality of the data and leave the evidence for it.
| Data provider | Diagnostic tool | Guideline publisher |
|---|---|---|
| Prepares measurement inputs (code tables · reference time · value ranges) · checks the diagnostic report · fixes values that can be fixed · records limitations that cannot be fixed | Measures indicators · calculates scores · judges Diagnostic Maturity · produces the diagnostic report | Issues and publishes the operating guideline (including the threshold profile) |
The release version of the diagnostic tool is in development. The release plan is in Development status and upcoming releases.
The data provider does not apply the measurement formulas to calculate scores. The data provider prepares the material needed for measurement. The data provider checks the diagnostic report for low-scoring indicators and reasons for not measuring. The data provider records fixable values and unfixable limitations separately.
In stage 2, the data provider fills in missing values or corrects wrong values. Data values can therefore change in stage 2.
| Work | Output |
|---|---|
| Measuring quality in the seven dimensions | Diagnostic report |
| Fixing the values of low-scoring indicators | Cleaned version |
| Recording the fixes | Processing history |
| Recording limitations that cannot be fixed | Limitation record |
| Recording measurement results and limitations in the manifest | Manifest understanding layer |
Seven dimensions Required
The standard measures quality in seven dimensions: Completeness (D1) · Consistency (D2) · Accuracy (D3) · Timeliness (D4) · Validity (D5) · Uniqueness (D6) · Machine readability (D7). [Part 2 5.2]
Check machine readability (D7) first. If the file cannot be opened, the other six dimensions cannot be measured. [Part 2 7.3]
The definitions, measurement formulas and preconditions of the 16 indicators are in Quality indicators. How to fix low scores is in Fixing defects (stage 2).
Scores versus tiers
Scores and the quality tier are different values. The diagnostic tool calculates a score for each indicator and records a score for each of the seven dimensions in the diagnostic report.
The quality tier is judged with the threshold profile of an operating guideline. The same scores can yield different tiers under different operating guidelines. A diagnostic report with no operating guideline applied records the quality tier as “not judged: no operating guideline applied.”
Tier judgment starts from the minimum dimension score (the lowest of the seven dimension scores). If one dimension scores low, that dimension determines the candidate tier even when the other dimensions score high. Averages are not used for tier judgment.
The example threshold profile in Part 2 Appendix I has the status EXAMPLE. It is used only for provisional calculations and tool development, not for tier judgment.
Results measured without an operating guideline are still valid baseline data. The data provider keeps the scores and the reasons for not measuring. When an operating guideline is applied, indicators whose measurement method changes with the guideline’s values (for example, the dummy-value patterns of
D5-03) are measured again. Measuring again means issuing a new diagnostic report.
The operating guideline provided with the standard will be published when the standard is established (expected December 2026). Organizations and institutions can build their own operating guideline and judge tiers. How to build an operating guideline is in Building an operating guideline, and the steps of tier judgment are in Judgment procedure. Tier judgment is not a procedure the data provider performs.
Diagnostic Maturity Required
The diagnostic report records Diagnostic Maturity separately from the scores. Diagnostic Maturity is how far the required indicators have been measured. The diagnostic tool applies the decision table from the top and judges Diagnostic Maturity by the first row that is met. [Part 2 Annex B.5 Table B.4]
The Diagnostic Maturity reached without an operating guideline differs by data type. Tabular (STRUCT) and time series (TSERIES) data reach DM-0 (provisional). The diagnostic tool provisionally measures D5-03 (Statistical plausibility), a minimum measurable indicator (MMI), with the example patterns in Part 2 Appendix I and records the evaluation status as PROVISIONAL. Text (TEXT) data reaches DM-2 when all five required formal indicators are measured. Instruction–response pairs (PT) and images (IMAGE) are at DM-0. Measuring D3-02 (Label accuracy) for these two types requires expert review results. DM-1 is not judged. The lower bound of evaluation coverage for DM-1 is set by the operating guideline. [Part 2 5.1 · Annex A.4.1 · Appendix I]
The table by type is in Reading the diagnostic report (stage 2), and the row-by-row conditions of the decision table are in Judgment procedure.
If a file is empty (0 records) or damaged and cannot be opened, the diagnostic tool records Diagnostic Maturity and the tier as “not judged.”
The five indicator applicability values and reasons for not measuring
The diagnostic report records an applicability value for each indicator. What the data provider does depends on this value. [Part 2 Annex B.2]
| Applicability value | Meaning | Data provider’s action |
|---|---|---|
APPLIED | The indicator was measured. A score is recorded | None |
PARTIALLY_APPLIED | Only targets with reference material were measured. No score is recorded (null) | Obtain reference material for the remaining targets |
PRECONDITION_UNMET | Not measured because reference material needed for measurement (for example, a code table) is missing | Obtain the reference material and measure again |
NOT_APPLICABLE | The indicator does not apply to that data type or condition | None |
OPTIONAL_SKIPPED | An optional indicator was not measured | None |
NOT_APPLICABLE is not a deficiency. There is nothing to fix.
If even one indicator is PARTIALLY_APPLIED, Diagnostic Maturity cannot be DM-2. If Diagnostic Maturity is not DM-2, the quality tier is “not judged: below DM-2” however high the scores are. Scores and Diagnostic Maturity do not substitute for each other. [Part 2 8.1]
The full list of status values and reasons for “not judged” is in Status and judgment values.
Order for reading the diagnostic report
The six values in the diagnostic report and how to read each one are in Reading the diagnostic report (stage 2).
Completion criteria
- A list of the material needed for measurement is ready (whichever of the data file, stage 1 manifest, code tables, reference time and value ranges apply to your data)
- If you have received a diagnostic report, Diagnostic Maturity and the reasons for not measuring are checked
What you need Producing a diagnostic report requires the diagnostic tool. The release version of the diagnostic tool is in development (Development status and upcoming releases).
Preparing data › Procedure
Fixing defects (stage 2)
Contents
ContentsThis page shows how to fix low-scoring indicators in stage 2 and how to record limitations that cannot be fixed. Keep the fixed file (the cleaned version) separate from the original.
GoalFix the values behind low-scoring indicators and record the limitations that cannot be fixed. Keep the original file, the cleaned version and the diagnostic report separate.
Fixing low-scoring indicators Recommended
The data provider’s cleaning work falls into three categories.
| Category | Work | Dimensions improved |
|---|---|---|
| Cleaning column names | Unify differing column names and notations into one | Consistency (D2) · Machine readability (D7) |
| Cleaning values | Align values with identifiers, classification schemes and standard codes | Completeness (D1) · Consistency (D2) · Validity (D5) · Uniqueness (D6) |
| Adding descriptions | Record measurement results and limitations in the manifest | Machine readability (D7) |
Priority actions by dimension
Priority actions by dimension — expand the 7-row table
| Low-scoring dimension | Priority action |
|---|---|
| Completeness (D1) | Check empty values in key columns. If they cannot be filled, use one notation for empty values and record that fact |
| Consistency (D2) | Check whether one concept goes by different names. Unify date and code notation |
| Accuracy (D3) | Compare against the source material. If there is no reference material, leave it as “accuracy not measured” and record the reason |
| Timeliness (D4) | Align the stated update frequency with the actual update history. State only a frequency you can keep |
| Validity (D5) | Define rules for data types, allowed values and required values, and find rows that break them |
| Uniqueness (D6) | Define the criterion for treating rows as the same (the record key). Without a key, record-level duplicate judgment is uncertain |
| Machine readability (D7) | Convert to an open format. Remove merged cells, subtotal rows and multi-line headers |
Recording limitations that cannot be fixed Required
The data provider also records limitations that cannot be fixed. Users read the recorded limitations to decide whether to use the data and how far. Users cannot see constraints that are not recorded.
| What to record | Example |
|---|---|
| Known bias | Nationwide in scope, but over 90% of the data is from the Seoul metropolitan area |
| Unsuitable uses | Statistics based on resident registration; unsuitable for analyzing the actual resident population |
| Causes of missing values | Missing values caused by sensor maintenance (2.1%) and communication errors (1.1%) |
| Reasons for not measuring | Accuracy not measured because there is no source material to compare against |
Recording a limitation is not a judgment of a defect. It is information users need to judge the scope of use.
Managing the original, the cleaned version and the diagnostic report Required
The cleaned version keeps the dataset’s persistent identifier. A cleaned version is not a different dataset. The data provider keeps the original file, the cleaned version, the release version, the manifest, the diagnostic report and the purpose-specific operation files distinct from one another.
| What to distinguish | How to distinguish it |
|---|---|
| Original file and cleaned version | By distribution and SHA-256 checksum |
| Release version | By version number |
| Manifest | A new one is issued for each version and refers to the previous version [Part 3 5.1] |
| Diagnostic report | A new one is produced for each measurement |
| Purpose-specific operation files | A separate file is produced for each use purpose type |
Keep the original file. Do not overwrite the original file with the cleaned version.
When an existing diagnostic report can be reused
Reuse an existing diagnostic report only when all four of the following are the same. If any one changes, produce a new diagnostic report.
- The version measured
- The measurement rules
- The operating guideline applied
- The validity of the measurement time
If the data was cleaned or measured again, produce a new diagnostic report. The manifest points to the new diagnostic report by its address and checksum.
Items to record in the processing history [Part 4 12]Follow-on part
| Item | Example |
|---|---|
| Work done | Imputing missing values · normalizing code values · removing duplicates |
| Date of work | 2026-08-14 |
| Version change | Original v1.0.0 → cleaned version v1.1.0 |
| Reason for change | Filled in missing district-level values · split age groups into 5-year bands |
Without a processing history, users cannot verify the cleaning results.
Common errors
The three most common errors in stage 2 are listed below.
- Judging the tier from the average score (tier judgment starts from the minimum dimension score)
- Publishing a tier calculated with values that are not an operating guideline (for example, the example threshold profile)
- Not updating the diagnostic report after cleaning
| Wrong | Corrected | Cause of the problem |
|---|---|---|
| Summarizing dimension scores D1 0.92 · D2 0.88 · D3 0.93 · D4 0.86 · D5 0.89 · D6 1.00 · D7 0.97 as a weighted average of 0.925 and judging the tier from it | Start the candidate tier calculation from the minimum dimension score, D4 0.86 | An average dilutes a critical shortfall in one dimension. The weighted average 0.925 is calculated with the dimension weights of the example threshold profile (Part 2 Appendix I, status EXAMPLE). The example threshold profile is not used for tier judgment |
| Assigning a tier to the dimension scores of case J-GR-001 without an operating guideline | Record only the scores and Diagnostic Maturity. The quality tier is “not judged: no operating guideline applied” | The same scores yield different tiers depending on the operating guideline applied. A value calculated with the example threshold profile is not a tier |
| Leaving the previous diagnostic report in place after cleaning the data | Produce a new diagnostic report. The manifest points to it by its address and checksum | An existing diagnostic report is reused only when the version measured, the measurement rules, the operating guideline and the measurement time are all the same |
Why it matters
The work in stage 2 creates the basis on which users judge whether the data can be reused. The data provider leaves limitations and a processing history along with the quality scores. Without the state of the values and the reasons for changes, users cannot judge the data’s constraints.
Quality scores and tiers are requirements the standard adds for AI use. The international FAIR principles do not require quality scores or tiers.
Completion criteria
- Cleaned version, processing history and limitation records written
- Original file kept (a different file with a different checksum from the cleaned version)
What you need Measure the cleaned version again with the diagnostic tool to produce a new diagnostic report. This requires the diagnostic tool. The release version of the diagnostic tool is in development (Development status and upcoming releases).
Preparing data › Procedure
Reading the diagnostic report (stage 2)
Contents
ContentsThis page shows how to tell measured indicators from indicators that were not measured in the diagnostic report produced by the diagnostic tool, and how to choose the next action for each indicator that was not measured.
GoalSeparate what was measured from what was not measured in the diagnostic report, and find why each indicator was not measured and what material it needs.
This site does not accept files for diagnosis. The release version of the diagnostic tool is in development; the release plan is in Development status and upcoming releases. Actual measurement results are in Public data examples and Walkthrough with example data.
Structure of the diagnostic report
The diagnostic report records six values separately. The data provider reads them in order, from the top.
| Value | Question it answers | Form of the value | Decided by |
|---|---|---|---|
| Indicator applicability | Was the indicator measured? | APPLIED · PARTIALLY_APPLIED · PRECONDITION_UNMET · NOT_APPLICABLE · OPTIONAL_SKIPPED | Standard |
| Indicator score | What is the value of a measured indicator? | From 0 to 1 | Standard (measurement formula) |
| Reason for not measuring | Why was it not measured? | A sentence stating the reason, recorded with the applicability value | Standard |
| Diagnostic Maturity (DM) | How far were the required indicators measured? | DM-0 · DM-1 · DM-2 · not judged | Decision table (standard) · the lower bound for DM-1 is set by the operating guideline |
| Quality tier | What level is the measured quality? | Tier 0–4 · not judged | Threshold profile of the operating guideline — not judged if none is applied |
| Readiness state | What state is the data in? | Discoverable · Quality-Ready · Purpose-Ready | Transition judgment at the decision gate [Part 1 5.2] |
Scores and Diagnostic Maturity do not substitute for each other. If Diagnostic Maturity is not DM-2, the quality tier is “not judged: below DM-2” however high the scores are. The Diagnostic Maturity decision table is in Judgment procedure. The meaning of each indicator applicability value and what the data provider does for it are in Measuring quality (stage 2).
Diagnostic Maturity by data type
The Diagnostic Maturity reached without an operating guideline differs by data type. The indicators that block Diagnostic Maturity and the material the data provider must prepare also differ by type. The table below shows the results of measuring the cleaned versions of the public data examples.
| Example | Diagnostic Maturity (cleaned version) | Blocking indicator | What is needed |
|---|---|---|---|
STRUCT × KG | DM-0 (provisional) Under review | D5-03 (Statistical plausibility) — dummy-value patterns set by the operating guideline · D2-02 (Referential integrity) partially measured | Operating guideline · code table values (D2-02) |
TSERIES × Stats | DM-0 (provisional) Under review | D5-03 — dummy-value patterns set by the operating guideline | Operating guideline |
TEXT × RAG | DM-2 | None | — |
PT × FineTuning | DM-0 | D3-02 (Label accuracy) — expert review results are an input | A ground-truth set reviewed by experts |
IMAGE (no example) | — | D3-02 — expert review results are an input | A ground-truth set reviewed by experts · label-match criteria (indicator parameters in the operating guideline) |
The Diagnostic Maturity of the tabular (STRUCT) and time series (TSERIES) examples is a provisional value, with D5-03 measured using the example patterns in Part 2 Appendix I. Results measured with the example patterns are being checked against the standard text.
DM-1 does not appear in the four examples. DM-1 is judged by whether evaluation coverage is at or above the lower bound in the operating guideline. Without an operating guideline, DM-1 is not judged. A result that measured every minimum measurable indicator (MMI) but did not reach DM-2 is therefore DM-0.
The document (TEXT) example reaches DM-2 even without an operating guideline. D5-03 does not apply to the document type. The diagnostic tool measured all five required formal indicators for the document type. With an operating guideline applied, the quality tier of the document example can be judged.
The row-by-row conditions of the decision table are in Judgment procedure.
Quality tier and readiness state
The quality tier of all four examples is “not judged: no operating guideline applied.” This includes the document example, whose Diagnostic Maturity is DM-2. The quality tier is judged with the threshold profile of an operating guideline. This site does not assign tiers with the example threshold profile (status EXAMPLE).
The operating guideline provided with the standard will be published when the standard is established (expected December 2026). Organizations and institutions can build their own operating guideline and judge quality tiers. Whoever judges a tier records the operating guideline’s identifier and version with the tier and publishes the operating guideline it applied. How to build an operating guideline is in Building an operating guideline.
The readiness state of all four examples stays at Discoverable. A transition to Quality-Ready requires all three of the following conditions.
- Diagnostic Maturity DM-2
- Quality tier Tier 1 or higher
- An operating guideline applied
Even an example with a manifest, a diagnostic report, a processing history and purpose-specific operation files gets a quality tier only when an operating guideline is applied. The Quality-Ready transition can be judged only once there is a quality tier. [Part 1 5.1]
Sorting indicators that were not measured
The data provider sorts the indicators that were not measured into three groups by the material they need.
| Group | Meaning | Example |
|---|---|---|
| Can be done now | No additional material needed | Designating a record key · entering metadata elements |
| Can be done after obtaining material | The material to obtain and the indicators it makes measurable | Code table → D2-02 (Referential integrity) · D3-01 (Standard name conformance) |
| Outside the data provider’s scope | Record the reason and wait | Applying an operating guideline → tier judgment |
Completion criteria
- Distinguish the six values in the diagnostic report (indicator applicability · indicator score · reason for not measuring · Diagnostic Maturity · quality tier · readiness state)
- Identify the indicators that block Diagnostic Maturity and their reasons
- Sort the indicators that were not measured into three groups (can be done now · can be done after obtaining material · outside the data provider’s scope)
What you need The diagnostic report for your own data is produced by the diagnostic tool. The release version of the diagnostic tool is in development. Until then, you can learn how to read a report from the measurement results in Public data examples.
Preparing data › Procedure
Packaging and distribution
Contents
ContentsThis page covers the pack, the unit for distributing prepared data: its constituent files, the references between those files, and how to verify a pack before distribution.
A pack is a distribution unit [Part 1 3.15 · 5.5 · Part 3 5.1]. The operating guideline sets the detailed structure of a pack (file layout · bundle format). The operating guideline provided with the standard will be published when the standard is established (expected December 2026). All file names and addresses on this page are Example.
Basic principles
- The dataset is the entity; the manifest is the document that describes the dataset. The manifest’s identifier differs from the dataset’s identifier. [Part 3 5.1]
- The manifest points to the diagnostic report and the operation files by address and SHA-256 hash. [Part 3 5.2]
- The diagnostic report is the source of record for quality judgment results. The quality elements in the manifest are a summary of the diagnostic report. [Part 3 5.2 · Part 2 9]
- Data files are not placed in the pack. The distribution in the manifest points to the data files by address and hash. [Part 3 5.1]
- Layers (discovery · understanding · operation) are divided by the function of the metadata, not by file format or location. [Part 3 5.1]
Files required by readiness state
The metadata scope of each state includes the scope of the preceding state. [Part 3 5.3]
Choose a state to highlight only the files that state requires. Choose a file to see its basis in the standard and how it points to other files. All file names · addresses · hashes · scores are fictional values for illustration.
View as a table
| Readiness state | Required files | Layers recorded | Transition judgment |
|---|---|---|---|
| Discoverable | 1 manifest. If the column schema is a separate document, that document is included too | Discovery layer | Decision gate G1 — required discovery-layer elements met |
| Quality-Ready | Manifest · diagnostic report · pack manifest | Discovery · understanding layers | Decision gate G2 — Diagnostic Maturity DM-2, quality tier Tier 1 or higher judged with the operating guideline’s threshold profile |
| Purpose-Ready | Quality-Ready pack + 1 operation file per use-purpose type | Discovery · understanding · operation layers | Decision gate G3 — required operation-layer elements of the registered purpose profile met |
In the Discoverable state, the manifest is published. A pack is a distribution unit created from Quality-Ready onward. The details of the decision gate judgment procedure are covered in Part 4follow-on part.
Source and summary
The manifest points to the diagnostic report by address and hash and records a summary of some of the report’s values in the understanding layer. Part 2 Table 9-2 defines the items to summarize. If a summary value differs from the report value, the report value takes precedence and the mismatch is treated as a verification failure. [Part 3 5.2 · Part 2 9.2]
| Part 2 Table 9-2 item | Diagnostic report key | Manifest property (vocabulary number) | Example value |
|---|---|---|---|
| Minimum dimension score | qualityIndex.minDimensionScore | aird:qualityIndexMin (2.2.9) | 0.82 |
| Weighted average | qualityIndex.weightedAverage | aird:qualityIndexAvg (2.2.10) | 0.91 |
| Minimum measurable indicator (MMI) score | qualityIndex.mmiScore | aird:qualityIndexMMI (2.2.11) | 1.0 |
| Quality tier and label | qTier.tier · qTier.label | aird:qualityTier · aird:qualityTierLabel (2.2.3 · 2.2.5) | Tier2 · Silver (Tier 2, STRUCT) |
| Diagnostic Maturity (DM) | diagnosticMaturity | aird:diagnosticMaturity (2.2.12) | DM-2 |
| Data type | dataType | aird:dataType (2.2.2) | STRUCT |
| Diagnosis time | generatedAt | prov:generatedAtTime (2.2.15) | 2026-…T…+09:00 |
| Threshold profile identification | thresholdProfile | aird:thresholdProfile (2.2.20) | identifier · 1.0 · hash · OFFICIAL |
| Judgment rule version and schema version | diagnosticInfo.ruleVersion · schemaVersion | aird:ruleVersion · aird:schemaVersion (2.2.17 · 2.2.18) | … |
| Transition eligibility | qTier.qualityReadyEligible | aird:qualityReadyEligible (2.2.14) | true |
The manifest properties are the quality assessment (aird:QualityAssessment) elements of AIRD vocabulary v0.10.5. The mapping between Part 2 Table 9-2 and these properties is not in the body of the deliberation draft. The tier in the example values is the result of applying a fictional organization’s operating guideline (an OFFICIAL threshold profile).
Verification before distribution
Record a SHA-256 hash for every file that the pack contains or references, whether or not the file is placed in the pack. If even one hash does not match, verification fails. A hash mismatch is grounds for suspension (Stale). There are five verification items. [Part 3 9.2 · Table 9-3]
| # | Verification item | Description | Where to check in the pack |
|---|---|---|---|
| 1 | Diagnostic report reference | The address of the diagnostic report the manifest points to is valid and its hash matches | Manifest quality assessment → diagnostic report |
| 2 | Summary values match | The summary values in the manifest match the values in the diagnostic report. Scope: Part 2 Table 9-2 | Quality assessment elements ↔ diagnostic report |
| 3 | Understanding layer complete | All required elements of the declared state and referential integrity are in place | Entire manifest + hashes of referenced files |
| 4 | State matches metadata scope | The declared state matches the scope of the layers actually recorded. Fails whether the scope is too wide or too narrow | Status declaration ↔ layers recorded |
| 5 | Versions of derivatives match | The source data version of each operation file matches the dataset version in the diagnostic report | Operation file ↔ diagnostic report |
Passing verification does not by itself trigger a transition to Quality-Ready. The transition requires passing decision gate G2. [Part 3 9.3]
Distribution and publication
- Keep the data files at their original distribution point (Korea Public Data Portal (data.go.kr) · internal repository). The pack points to the data files by address and hash.
- Place the manifest and the pack files at a public address where users and agents can download them. For public-sector data, record the portal’s dataset detail page address in
dcat:landingPage. - When you fix or re-measure the data, publish the manifest as a new version. Do not change the files of earlier versions.
- The bundle format and file layout of the pack follow the operating guideline you apply.
- Publication to catalogs · registries, discovery, and exchange are covered in Part 5follow-on part.
The four Public data examples are materials that explain measurement results. They were not distributed in the pack structure on this page. Because no operating guideline was applied, their readiness state is Discoverable. A full manifest example is in Manifest example.
Completion criteria
- All files required for the declared readiness state are in place.
- A SHA-256 hash is recorded for every file the manifest points to.
- No data files are placed in the pack.
- The summary values in the manifest are the same as the values in the diagnostic report.
Preparing data › Examples
Walkthrough with example data
Contents
ContentsThis page applies the preparation stages one by one to a single example file (20 business registration records) and shows what is recorded at each stage and how the measurement results change.
Example The example file contains fictional data for illustration. It does not refer to any real organization or data. The figures on this page were obtained by measuring the example file with this site’s measurement engine (test version). To reproduce the results, use the same input file · tool version · measurement rules.
① Data overview
Source file
The source file is example.csv, a CSV file with 20 rows · 8 columns in UTF-8 encoding. The first three rows are as follows.
| bizId | bizName | industryCode | regionCode | employeeCount | revenueBand | registeredOn | closedFlag |
|---|---|---|---|---|---|---|---|
| B-2019-0001 | Gaon Precision | C29294 | 11680 | 42 | B3 | 2019-03-11 | 0 |
| B-2019-0014 | Daeseong Packaging | C22240 | 41135 | 17 | B2 | 2019-05-02 | 0 |
| B-2019-0033 | Hanbyeol Electronics | C26429 | 28185 | 133 | B4 | 2019-07-19 | 0 |
At the start there is only the file, with no description.
Type judgment: tabular STRUCT — the example file has rows and columns, and each column has a defined datatype. [Part 1 5.6 Table 5-5]
Personal information check — business names are corporate information. However, the business name of a sole proprietor may count as personal information. The data provider does not decide this alone but checks it together with the department responsible for personal information protection. The check procedure is in Checking your data.
② Writing the discovery layer (metadata elements · column schema)
Example data · measured In stage 1, the data provider fills in the discovery layer of the manifest. Stage 1 does not change data values. What stage 1 adds is information that explains the meaning · format · origin of the values.
What the data provider filled in: 19 dataset metadata elements
19 dataset metadata elements — expand 17-row table
| Element | Value entered |
|---|---|
| Identifier | https://data.example.go.kr/id/dataset/biz-registry |
| Title | Example business registry |
| Description | Dataset of registration information and business status of workplaces by region |
| Keyword | business · industry classification · region · business status (4) |
| Data service type | FILE (file) |
| Dataset structure type | Structured (tabular) |
| Language | KOR |
| Lifecycle status | Discoverable |
| Theme | INDUSTRY_EMPLOYMENT |
| Landing page | https://data.example.go.kr/dataset/biz-registry |
| Creator · publisher | Example Agency |
| Maintaining department · contact point | Example Agency Data Management Team · data@example.go.kr |
| Creation method | collected (survey · measurement) |
| Update frequency | ANNUAL (once a year) |
| License | KOGL-1 (KOGL Type 1, Korea Open Government License) |
| Rights | KOGL Type 1. Commercial use and modification are allowed with attribution of the source. |
| Access rights | PUBLIC |
For value-list elements, choose a notation value (for example KOR · KOGL-1). The manifest holds the concept URI from the AIRD vocabulary. How to fill in each element is in Metadata elements.
The example organization has no identifier assignment policy. So the data provider applied the default pattern from Choosing persistent identifiers, https://data.<organization domain>/id/dataset/<name>. The dataset identifier is as follows.
https://data.example.go.kr/id/dataset/biz-registryWhat the data provider filled in: column schema for 8 columns
The data provider recorded the datatype and description of the 8 columns in the column schema (csvw:tableSchema).
Column schema — expand 8-row table
| Column | Datatype | Description |
|---|---|---|
bizId | string | Unique business registration number. Format B-YYYY-NNNN. Required column |
bizName | string | Business name |
industryCode | string | Korean Standard Industrial Classification sub-class code |
regionCode | string | Administrative standard code: legal-district city/county/district code |
employeeCount | integer | Number of regular employees. From 0 to 100000 |
revenueBand | string | Revenue band code. B1 to B4 |
registeredOn | date | Date of first registration. ISO 8601-1 date |
closedFlag | integer | Closure flag. 0 is operating, 1 is closed |
The data provider marked bizId as a required column. The diagnostic tool can measure D1-01 (Required field completeness) only when required columns are marked.
The data provider must also record the meaning of code values. For example, if it is not recorded which revenue band B3 in revenueBand stands for, users and agents cannot interpret the revenueBand column.
The “from 0 to 100000” in the employeeCount description is a description for people to read. For the diagnostic tool to measure D5-02 (Numeric range validity), the minimum · maximum (minimum · maximum of the CSVW datatype) must be recorded separately in the column schema’s datatype. This example records them only in the description, so D5-02 remains not measured.
4 distribution metadata elements
| Element | Value | Recorded by |
|---|---|---|
| Access URL | https://data.example.go.kr/aird/.../example.csv | Data provider |
| Media type | text/csv | Measurement engine |
| File format | CSV | Data provider |
| Checksum | 7ad8add25d7a6383… (SHA-256) | Computed from the file by the measurement engine |
The measurement engine also produced per-column observations (share of non-empty values · number of distinct values · sample values). In this example the measurement engine computed the checksum. The data provider can also compute the checksum directly with a common tool such as sha256sum.
③ Measuring quality
Example data · measured The example file was measured twice with this site’s measurement engine (test version). The first time, only the file existed. The second time was after the stage 1 metadata elements were filled in and bizId was designated as the record key. The figures below are measured values, not calculation examples.
File only compared with after stage 1
| Item | File only | After stage 1 |
|---|---|---|
| Metadata elements | 1 / 23 | 23 / 23 |
| Column descriptions | 0 / 8 | 8 / 8 |
| Required formal indicators measured | 6 / 13 | 7 / 13 |
| Diagnostic Maturity (DM) | DM-0 (provisional) | DM-0 (provisional) |
| Quality tier | Not judged: no operating guideline applied | Not judged: no operating guideline applied |
| Judgments the agent must guess | 10 | 2 |
- The 1 metadata element met with the file only is the checksum that the measurement engine computed from the file.
- After stage 1, one more indicator was measured. Because the data provider marked
bizIdas required,D1-01(Required field completeness) became measurable. - The data values did not change. Only the recorded information needed to interpret the values increased.
The 4 minimum measurable indicators (MMI) (D5-03 · D6-01 · D7-01 · D7-02) were measured in both runs. Because there is no operating guideline, D5-03 (Statistical plausibility) is a provisional value measured with the example patterns in [Part 2 Appendix I]. Only 7 of the 13 required formal indicators were measured, so the Diagnostic Maturity does not reach DM-2. The decision table that determines Diagnostic Maturity is in Judgment procedure.
The quality tier was not judged because no operating guideline was applied, not because of the data. Even if every score is 1.0000, no tier is judged without an operating guideline. The assessment status PROVISIONAL in the diagnostic report means a provisional measurement; it is not a tier.
Indicator scores with the file only
rows 20 · columns 8 · encoding UTF-8

1. Metadata elements (23)   met 1 / 23
2. Column schema            none: a draft is generated from headers and values
3. Quality measurement
     D1-02  Required metadata completeness   0.0435
     D5-01  Format validity                  1.0000
     D5-03  Statistical plausibility         1.0000 (provisional)
     D6-01  Uniqueness                       1.0000
     D7-01  Encoding consistency             1.0000
     D7-02  Technical validity               1.0000
The file opens and its format is valid, but there is no description. Because no record key was designated, D6-01 (Uniqueness) was measured over the combination of all columns.
Indicator scores after stage 1
| Indicator | What is measured | Score |
|---|---|---|
D1-01 | Required field completeness | 1.0000 |
D1-02 | Required metadata completeness | 1.0000 |
D5-01 | Format validity | 1.0000 |
D5-03 | Statistical plausibility · MMI | 1.0000 (provisional) |
D6-01 | Uniqueness · MMI | 1.0000 |
D7-01 | Encoding consistency · MMI | 1.0000 |
D7-02 | Technical validity · MMI | 1.0000 |
All 20 records had the correct format, so there were no values to fix. The example file has had its format errors removed. With real data, D5-01 (Format validity) and D7-01 (Encoding consistency) can measure below 1.0000. Measurement results for real public-sector data are in Public data examples.
Indicators not measured and why
The diagnostic report records the indicators not measured together with the materials needed to measure them. The 6 indicators not measured for the example file are listed below. This list is the list of materials the data provider has to obtain.
| Indicator | Materials needed for measurement |
|---|---|
D2-01 Inter-field consistency | Relationship rules defined in the column schema or the manifest |
D2-02 Referential integrity | Actual values of the master code table to compare against (an address or reference alone is not enough) |
D2-03 Derived value accuracy | Definition of the rules for calculating derived values (not applicable if no derived values are stored) |
D3-01 Standard name conformance | An authoritative reference usable as a code–name mapping. The data must contain both codes and names |
D4-01 Currency | Reference date and update history |
D5-02 Numeric range validity | Definition of the allowed numeric range per column |
How to read the reasons for not measuring is in Reading the diagnostic report (stage 2).
Diagnostic report excerpt
generatedAt   2026-10-05T...
datasetFile   example.csv
fileChecksum  SHA-256 7ad8add2...
dataType      STRUCT
recordCount   20
indicators    D1-01 1.0 (required) · D5-01 1.0 (required) · D5-03 1.0 (required · provisional) · ...
notMeasured   D2-02 (required): compare against actual values of the master code table
              D3-01 (required): an authoritative reference is needed
formalAssessmentCoverage  0.5385
diagnosticMaturity        DM-0
assessmentStatus          PROVISIONAL
thresholdProfile          example profile (EXAMPLE)
note Provisional diagnostic report produced with an example profile. Do not use for official disclosure or cross-organization comparison.formalAssessmentCoverage0.5385 is a coverage value meaning that 7 of the 13 required formal indicators were measured. It is not a quality score or a tier.assessmentStatusPROVISIONALis the assessment status indicating thatD5-03was measured provisionally with example patterns.- The example threshold profile in
thresholdProfilehas the statusEXAMPLE. An example threshold profile is for provisional calculation only and is not used for tier judgment.
④ Preparing for a purpose
Example data · measured The data provider identifies the use purposes that the example data can support. The review is limited to purposes relevant to the example data.
| Use purpose | Relevance of the example data | Judgment |
|---|---|---|
| ML (machine learning) | Label column candidate closedFlag (closure flag) | Candidate |
| KG (knowledge graph) | Standard code columns industryCode · regionCode | Candidate |
| Stats (statistical analysis) | registeredOn is a registration date, not a time-ordered measurement | Not applicable |
| RAG (retrieval-augmented generation) | No natural-language documents | Not applicable |
| DL (deep learning) | No images | Not applicable |
| FineTuning (fine-tuning) | No instruction · response pairs (PT) | Not applicable |
Choosing purposes alone does not complete stage 3. The output of stage 3 is a purpose-specific operation file, one per purpose type. A purpose tier is judged only when the purpose profile for that purpose is registered. If the purpose profile is not registered, the data provider records the purpose tier as “not judged” together with the reason PROFILE_NOT_REGISTERED (purpose profile not registered).
Stage 3 is carried out after the use purpose is confirmed. By completing stage 1, the example data meets the metadata requirements of Discoverable, and it has a stage 2 diagnostic report. To become Quality-Ready, it needs Diagnostic Maturity DM-2 and a tier of Tier 1 or higher judged under an operating guideline.
Remaining work and why
The example file has completed stage 1 metadata and stage 2 measurement. Diagnostic Maturity DM-2 · the quality tier · purpose-specific operation files remain. The data provider records the reason for each remaining item by category, and does not mix unmet requirements in the data itself with the absence of an operating guideline. The list of reasons is in Status and judgment values.
| Reason category | Meaning | Items for the example file |
|---|---|---|
| Can be done now | No additional materials needed | Designating the record key · entering metadata elements (done in stage 1) · recording limitations |
| Can be done after obtaining materials | Materials to obtain and the indicators they make measurable | Code tables → D2-02 · D3-01; reference date · update history → D4-01 |
| Outside the data provider’s scope | Record the reason and wait | Applying an operating guideline → quality tier judgment |
Follow-up actions for the data provider
The follow-up action list that the measurement engine produced with the diagnostic report is as follows.
- Obtain the industry classification · legal-district code tables. Result:
D2-02(Referential integrity) can be measured. - Obtain code–name mapping materials. Result:
D3-01(Standard name conformance) can be measured. - Compile the reference date and update history. Result:
D4-01(Currency) can be measured. - Record limitations that cannot be fixed. Example: “
closedFlagmay be updated later than the actual closure because closure reports are filed late.” Result: recorded limitations in the understanding layer of the manifest. - Apply an operating guideline and re-measure the indicators it requires. Needed: the operating guideline provided with the standard (published when the standard is established, expected December 2026) or an operating guideline built and published by your organization. Result: a new diagnostic report and a tier judged under that operating guideline.
Preparing data › Examples
Public data examples
Contents
ContentsMeasurements of four real public datasets show how stage 1 documentation increases the number of indicators that can be measured, and how results differ by data type.
Example Measurements were taken on 2026-10-06. Quality tiers were not judged because no operating guideline was applied (not judged: no operating guideline applied).
Four examples
Each example pairs one data type with one representative use purpose and is built from real public data. The types are STRUCT (tabular) · TSERIES (time series) · TEXT (documents) · PT (instruction · response pairs). The purposes are KG (knowledge graph) · Stats (statistical analysis) · RAG (retrieval-augmented generation) · FineTuning (fine-tuning).
| Example | Type × purpose | Source | Size |
|---|---|---|---|
| Commercial (business district) store information — Sejong sample | STRUCT × KG | Small Enterprise and Market Service · Korea Public Data Portal (data.go.kr) 15083033 (202606 release) | 15,816 rows |
| Hourly national electricity demand (2025) | TSERIES × Stats | Korea Power Exchange · Korea Public Data Portal 15065266 | 8,760 time points |
| Article corpus of the Public Data Act and the AI Data Administration Act | TEXT × RAG | Saved PDF texts from the National Law Information Center of the Ministry of Government Legislation (current and forthcoming versions) | 4 versions · 209 articles · 673 units |
| Statutory interpretation question–answer pairs (51 cases) + comparison with 7 interpretations by the Korea National Data Office | PT × FineTuning | Ministry of Government Legislation Open API target=expc (8,881 listed → 51 found by case title and full-text search) · target=kostatCgmExpc (all 7) | 51 cases → 45 pairs |
Measured indicators before and after stage 1
Each example was measured three times.
- The original data was measured before stage 1.
- The same original data was measured after stage 1. In stage 1, the data provider recorded required fields · formats · value ranges · inter-field relations · derivation rules · code lists in the column schema (
csvw:tableSchema). - The cleaned version, with defects fixed, was measured.
| Example | Required formal indicators | ① Original · before stage 1 | ② Original · after stage 1 | ③ Cleaned |
|---|---|---|---|---|
STRUCT × KG | 13 | 5 / 13 | 11 / 13 | 11 / 13 |
TSERIES × Stats | 13 | 5 / 13 | 10 / 13 | 10 / 13 |
TEXT × RAG | 5 | 3 / 5 | 4 / 5 | 5 / 5 |
PT × FineTuning | 8 | 4 / 8 | 7 / 8 | 7 / 8 |
No data values changed between ① and ②. Yet the number of measured indicators increased, because the definitions recorded in stage 1 are the input to stage 2 measurement. Diagnostic Maturity (DM) by type is described in Reading the diagnostic report (stage 2).
Defects revealed by measurement
| Type | Defect | Indicator | Handling |
|---|---|---|---|
STRUCT | Commas in subcategory names were changed to semicolons (61 cells) | D3-01 (Standard name conformance) | Replaced with code list names → 1.0 |
STRUCT | 82 rows differ only in store number, with the other 38 columns identical | D6-01 (Uniqueness) 1.0 (by identifier) | Handled as entity candidates in preparation for a purpose (KG) |
STRUCT | Legal-dong names omit the ri — one name, “Geumnam-myeon”, maps to 26 legal-dong codes | — | Legal-dong code used as the KG entity identifier |
STRUCT | Values of the Korean Standard Industrial Classification and legal-dong code lists could not be obtained | D2-02 (Referential integrity) partially measured (coverage 0.6 · score not recorded) | Obtain the code list files and measure |
TSERIES | CP949 encoding | D7-01 (Encoding consistency) 0.0 | Saved again as UTF-8 → 1.0 |
TSERIES | Trailing empty row (366 rows on the portal · 365 actual rows) | D1-01 (Required field completeness) below 1 | Empty row removed |
TSERIES | Unit appears only in the description text | — | Unit recorded in the column description |
TEXT | PDF — headers · footers mixed into the body, and the effective date appears only in one header line | D7-01 (judgment method under review) | Split by article and recorded the effective date at the source location |
TEXT | Current and forthcoming versions of the same law | — | Versions distinguished with valid_from · valid_to |
TEXT | Update frequency “as needed” | D4-01 (Currency) not measured | Recorded the update commitment as a frequency value |
PT | 6 pairs of interpretations with identical content and different case numbers | D6-01 1.0 | Only one of each pair kept in the operation file |
PT | 7 empty values for the requesting agency name | D1-01 0.983 → 1.0 | Restored from the case title prefix, with the source recorded |
PT | A 2018 interpretation cites an article deleted in 2022 | — | Marked as a “deleted article” and not linked to the current article |
Defects can remain even when an indicator scores 1.0. D6-01 by identifier does not find rows that differ only in identifier but have the same content. The data provider handles such defects in preparation for a purpose (stage 3).
Catalog observation case
This is the result of observing the catalog metadata of one public dataset in the industry domain. The agency name is not shown. The subject is industrial complex company information (379 rows · 9 columns · CSV).
The basis for observation is the 19 required metadata elements of the deliberation draft (15 for the dataset + 4 for the distribution). The remaining 4 of the 23 in the vocabulary demo profile were added after the observation and were not classified.
| Category | Count | Elements |
|---|---|---|
| Recorded by the portal | 6 | title · publisher · file format · access URL · description · keyword |
| Needs format conversion | 3 | update frequency · media type · data service type |
| Must be newly written | 10 | dataset identifier · language · lifecycle status · creator · contact point · creation method · license · rights · access rights · checksum |
| Not classified (added after the observation) | 4 | dataset structure type · theme · landing page · maintaining department |
If the portal provides column structure information, a draft column schema can be made without the file. In this case, drafts for the 9 columns were made from the observed column names · data types · counts of distinct values. The data provider then adds a description for each column.
The observation result also flags items that need a personal information check. In this case, the phone number column was flagged as an item whose disclosure scope must be confirmed with the responsible department.
Even for a dataset with catalog metadata on the portal, 10 elements must be newly written. Data that is already registered on the portal still needs separate preparation for AI use.
The catalog observation case covers only catalog metadata observation and the discovery layer check. Once the file is obtained, a diagnostic report is added.
Completion criteria
- You found an example of the same type as your data.
- In that example, you checked how many more indicators were measured after stage 1 documentation.
- You checked whether your data has the same defects (for example, CP949 encoding · a trailing empty row · a unit only in the description text).
What you need: a diagnostic tool to measure indicators, and an operating guideline to judge quality tiers.
Next step: how to bundle and distribute the outputs is described in Packaging and distribution.
Preparing data › Examples
FAQ
Answers to frequently asked questions before you start preparing data (whether it is mandatory, how much work is involved, checksums, tier judgment).
- Is it mandatory?
- No. It is not an obligation under laws or regulations. Organizations and companies can cite this standard as a related standard in their data management guidelines, project requirements, or contract terms. Completing stage 1 alone already reduces the number of items an agent must guess.
- What do we gain?
- Agents and users can make three judgments without contacting the data provider: what the data is, whether it can be trusted, and under what conditions it may be used. The manifest also records the grounds on which an agent selects the data as a search result or a join candidate.
- How far do we need to go?
- Stage 1 alone establishes the discovery layer. With the discovery layer in place, users and agents can find the data and decide whether to use it. Set priorities in this order: data with use requests → data used in joins with other data → all other data. Recommended
- Do we have to fix the data?
- Stage 1 records descriptions without changing data values. Correcting values happens in stage 2, fixing defects. The data provider preserves the original and creates a separate cleaned version.
- How long does it take?
- The time required depends on how complete the existing registration information and column descriptions are. Generating and entering metadata can be automated with tools; the data provider writes only the items missing from the registration information.
- Who calculates the checksum?
- The data provider calculates the file’s SHA-256 checksum with a common tool such as sha256sum. When a diagnostic tool is used, the diagnostic tool calculates it.
- Do we have to change our systems?
- The data provider first uses the existing registration system and its export functions. If the existing system does not support entering required properties, version management, checksum generation, or publishing the manifest, add the missing functions.
- Can we do it without tools?
- Stage 1 can be done by hand. Indicator measurement in stage 2 is performed by a diagnostic tool. The release plan for the diagnostic tool is in Development status and upcoming releases. How to read the results is in Reading the diagnostic report (stage 2).
- What if the data contains personal information?
- The data provider does not decide alone but checks together with the department responsible for personal information protection. The checking procedure is in Checking your data.
- Do we have to redo data we have already published?
- You do not start over. The data provider keeps the existing persistent identifiers and fills in the missing descriptions. Check the column schema and the license statement first.
- Can we get a tier now?
- Tiers are judged by applying an operating guideline. The operating guideline provided by the standard will be published when the standard is established (expected December 2026). An organization can build and publish its own operating guideline and judge tiers with it. A tier is recorded together with the identifier and version of the operating guideline applied. Tier judgment requires Diagnostic Maturity (DM) DM-2. Results without an operating guideline applied receive no tier (not judged: no operating guideline applied). How to build an operating guideline is in Building an operating guideline.
- What if a user reports a problem?
- The data provider reviews the report, takes the necessary action (cleaning, correcting the description, or updating), and records the handling status. The handling status is one of received, confirmed, resolved, or no action; for no action, record the reason. [Part 5 10]follow-on part Required
- What are the results used for?
- Measurement results are used in four ways: judgments by people looking for data, automated use by AI agents, internal priorities for data improvement, and evidence for reviewing the threshold profile of an operating guideline.
- Is there a penalty for recording something wrong?
- AIRD measurement is not an evaluation scheme. Measurement results are not used to compare or rank organizations.
- What is the status of Parts 4 and 5?
- They were adopted in the standard discussions but are follow-on parts outside the December 2026 establishment scope (Parts 1–3). This site marks such citations with a “follow-on part” label.
Inaccurate records are a bigger problem than low scores. Recording an unmeasured item as measured, or omitting a limitation, can lead users to wrong judgments. The data provider records anything not confirmed as unconfirmed or not measured.
What measured values are for: Guideline publishers can use measured values as evidence for reviewing threshold profiles. That is why the data provider records measured values and measurement conditions accurately. The threshold profile is part of the operating guideline.
Other paths · For agents — What agents read · Operating guidelines — Adoption brief
What agents read
Contents
ContentsThis page maps the information an agent needs for each of the four judgments it makes before using data to the clauses and metadata elements of the standard.
Where the tiers agents read come from. The quality tier written in a manifest is judged not by the standard but by the threshold profile of an operating guideline. Whoever judged the tier records the operating guideline’s identifier · version along with the tier and publishes that operating guideline. When an agent reads a tier, it also reads which operating guideline was used to judge it. The conditions for using a tier as evidence are in Fields and handling by judgment.
The standard is not limited to public data. It covers all data published or provided by public institutions · enterprises · non-profit organizations. Its goal is to let AI agents access data, understand it, trust it, and judge whether they may use it. The design started from observations of public data. Agents judge from structured fields and measurement evidence, not from a single score. The “How the standard covers each judgment” table is based on tabular data (STRUCT). Documents · images · instruction · response pairs (PT) need different information for these judgments.
How the standard covers each judgment
Required required by the standard · Partial conditionally required · optional · recommended, or measured but not exposed as a field · Gap not in required elements or indicators (whether optional elements cover it is under review)
Of the 24 pieces of information needed: required 9 · partial 10 · gap 5
Fitness — fit to the question
Judgment question · Does it fit my question?
Fitness — fit to the question — expand 7-row table
| Information needed | Standard | How the standard covers it |
|---|---|---|
| Temporal coverage | Gap | None The vocabulary term exists in DCAT-AP-KR (DCAT). It is not a required element of the AIRD discovery · understanding layers. Reference time and measurement interval for time series are recommended. Fill rate of “temporal coverage” in the portal catalog: 5.2% (Korea Public Data Portal catalog observation, 2026-08-31) |
| Spatial coverage | Gap | None Same as temporal coverage. Fill rate of “spatial coverage” in the portal catalog: 6.4% |
| Units | Partial | Unit in the column schema (recommended) · time series unit (recommended) |
| Population covered | Partial | Preparation item for the Stats (statistical analysis) purpose (recommended) · rai:dataBiases (known biases, required) |
| Column meaning | Required | Column schema (csvw:tableSchema) (conditionally required for structured data) |
| Data type | Required | dct:type · aird:dataType |
| Unsuitable uses | Required | rai:dataLimitations |
Reliability — grounds for trust
Judgment question · Can it be trusted?
| Information needed | Standard | How the standard covers it |
|---|---|---|
| Actually updated | Partial | D4-01 Currency (required) · D4-02 Update fidelity (optional for STRUCT) Update frequency is a required metadata element. Checking against the actual update history is an optional indicator |
| File integrity | Required | spdx:checksum · D7-02 Technical validity · suspension of validity (Stale) |
| API availability | Gap | Interface conformance of the providing system is a level separate from data-side conditions [Part 1 Table 6-1] The 16 quality indicators are file-based. Availability is not exposed as a fact attached to the data |
| API responses match the spec | Gap | None No API-side indicator corresponds to D7-02 for files |
| Values meet format · range | Required | D5-01 · D5-02 · D5-03 |
| Diagnostic Maturity | Required | Diagnostic Maturity (DM) · 5 indicator applicability values |
Joinability — ability to join
Judgment question · Can it be joined with other data?
| Information needed | Standard | How the standard covers it |
|---|---|---|
| Persistent identifier | Required | dct:identifier |
| Record key | Required | D6-01 Uniqueness (when identifier columns are designated) |
| Standard codes checked by value | Partial | D2-02 Referential integrity · D3-01 Standard name conformance The standard requires checking against the actual values of the code list (an address alone is not enough). Per-column results (code system and match rate) are only in the diagnostic report and are not exposed as metadata fields |
| Entity IDs and code list source | Partial | Preparation item for the KG (knowledge graph) purpose (recommended) |
Usability — conditions of use
Judgment question · May it be used?
Usability — conditions of use — expand 7-row table
| Information needed | Standard | How the standard covers it |
|---|---|---|
| Machine-readable license | Partial | dct:license (14 values in the vocabulary’s kr-license list — KOGL · CC · CC0) The value list is closed. There is no value for an enterprise’s own terms of use or for MIT · Apache · ODbL licenses. Extending the value list is a candidate for a vocabulary revision proposal |
| AI training permitted | Partial | odrl:hasPolicy (optional) · KOGL AI type (kr-license) The place for a machine-readable usage policy is an optional element. For data outside KOGL, no license value means training is permitted |
| Automated collection permitted | Partial | odrl:hasPolicy (optional) Even data that people can download and use may have terms that prohibit automated collection (for example, web crawling). There are cases where the terms of data provided free by enterprises include such a clause |
| Version of the terms of use | Gap | dct:rights notice (string) Own terms change with each revision. No field records which version (effective date) of the terms applies |
| Fee · contract terms | Partial | dcatkr:fee (recommended) · sc:offers (conditionally required when fee=true) Price · currency · unit can be recorded. There is no place for pay-as-you-go after a free quota or for terms limited to contracted customers |
| Access conditions | Required | dct:accessRights (eu-access: PUBLIC · RESTRICTED · NON_PUBLIC) |
| Contains personal data | Partial | aird:deidentificationLevel (conditional) · dpv:hasPersonalData (conditional) |
Proposal for exposing verified facts
Of the 7 facts in the “Standard status by fact” table, the standard already measures 5. The measurement results are recorded only in the diagnostic report. The manifest records only dimension scores. This site proposes a way to expose the measurement results in the manifest as facts.
Standard status by fact — expand 7-row table
| Fact | Judgment | Where the standard produces it | Standard status |
|---|---|---|---|
update_delay_days | Reliability | D4-01 (days elapsed − update frequency) | Measured, not exposed |
api_availability_7d | Reliability | Outside the standard | Not measured |
response_matches_spec | Reliability | Outside the standard | Not measured |
pk_uniqueness | Joinability | D6-01 | Measured, not exposed |
code_columns_matched | Joinability | D2-02 (per column) | Measured, not exposed |
encoding | Reliability | D7-01 | Measured, not exposed |
required_fields_nonnull | Fitness | D1-01 | Measured, not exposed |
Proposed exposure method
Summary of the coverage table
- Joinability has no gaps. The standard requires checking against the actual values of the code list. What remains is exposing the per-column check results as metadata fields.
- The 5 gaps are in fitness · reliability · usability. Temporal and spatial coverage are not required elements. Whether AI training is permitted appears only in an optional element. Agents use both kinds of information as conditions when selecting data.
- Reliability indicators are file-based. The 16 quality indicators target files. Availability and spec conformance of data provided through an API do not appear as facts recorded with the data.
Fields and handling by judgment
Contents
ContentsThis page shows in pseudocode which fields an agent reads from the manifest for each judgment and how it judges them. The fields and judgment values follow the standard; the judgment rules are this site’s recommendations.
Reading principle — do not replace a missing field with a guessed value. If there is no evidence, the agent states “no evidence” in its result. When a human judgment is needed, the agent hands the case over to human review. The standard aims to let agents judge without guessing, and the judgment rules on this page follow the same principle.
Fitness — fit to the question
Judgment question · Does it fit my question?
Fields read dct:description · csvw:tableSchema · dct:type · rai:dataLimitations · rai:dataBiases
schema = m.get("csvw:tableSchema")
if schema is None:
    return no_evidence("column meanings are not recorded")   # do not guess from column names
for col in columns_used_by_question:
    if not column(schema, col).get("dc:description"):
        return no_evidence(f"meaning of {col} is not recorded")
# rai:dataLimitations · rai:dataBiases are lists of human-written sentences.
# Do not filter them by string matching; present them as-is with the answer.
caveats = m.get("rai:dataLimitations", []) + m.get("rai:dataBiases", [])
return fit(caveats=caveats)
When the field is missing If the column schema (csvw:tableSchema) has no column description, the agent does not guess the meaning from the column name. It states “column meaning not recorded” in the answer.
Reliability — grounds for trust
Judgment question · Can it be trusted?
Fields read aird:lifecycleStatus · dcat:distribution[].spdx:checksum · dct:modified · dct:accrualPeriodicity · aird:diagnosticMaturity · aird:qualityTier · aird:thresholdProfile · aird:diagnosticReport
if m["aird:lifecycleStatus"] == "Stale":
    return exclude("validity suspended")
d = distribution(m, downloaded_url)               # each distribution has its own checksum
if sha256(downloaded_file) != d["spdx:checksum"]["spdx:checksumValue"]:
    return exclude("checksum mismatch — not the file the manifest points to")
dm = m.get("aird:diagnosticMaturity")
if dm is None:
    # null has two meanings. Tell them apart by the diagnosis status in the diagnostic report.
    if diagnosis_status(m) in ("SCHEMA_ONLY", "FILE_BROKEN"):
        return exclude("file could not enter diagnosis")
    return caution("Diagnostic Maturity not established — insufficient quality evidence")   # do not read as 0
# A tier is judged by the threshold profile of an operating guideline. Check all four conditions.
profile = threshold_profile(m.get("aird:thresholdProfile"))   # None if absent
guideline = operating_guideline(m)                 # identifier · version · URL — None if absent
tier_evidence = (
    dm == "DM-2"                                              # (a) Diagnostic Maturity DM-2
    and profile is not None
    and profile["status"] == "OFFICIAL"                        # (b) EXAMPLE is not tier evidence
    and evaluation_status(m) != "PROVISIONAL"                 # (c) not a provisional evaluation
    and guideline is not None and guideline.identifier and guideline.version
    and accessible(guideline.url)                             # (d) the published operating guideline can be checked
)
if not tier_evidence:
    return caution(f"Diagnostic Maturity {dm} · no tier evidence", score=m.get("aird:qualityIndexMin"))
return trusted(tier=m.get("aird:qualityTier"),
               guideline=(guideline.identifier, guideline.version),
               profile=(profile["profileId"], profile["version"]))
When the field is missing If Diagnostic Maturity (DM) is missing, the agent treats it as “insufficient measurement evidence”, not as “low”. The agent reads a tier as evidence only when all four of the following conditions are met.
| Condition | Value checked |
|---|---|
| (a) Diagnostic Maturity | DM-2 |
| (b) Status of the threshold profile | OFFICIAL (not EXAMPLE) |
| (c) Evaluation status | Not PROVISIONAL |
| (d) Operating guideline | The identifier · version of the operating guideline used for the judgment are known, and the published document is accessible. The standard does not yet have a manifest property that points to the operating guideline, so this is checked through the threshold profile identification (aird:thresholdProfile) and the operating guideline information recorded alongside the tier |
If any one condition is not met, the agent sets the result to “caution (… no tier evidence)” and reads the score only for reference. The structure and publication requirements of operating guidelines are in Building an operating guideline.
Joinability — ability to join
Judgment question · Can it be joined with other data?
Fields read dct:identifier · csvw:tableSchema.primaryKey · csvw:tableSchema.columns[].dc:description · D2-02 result in the diagnostic report
a, b = join_columns_of_the_two_datasets
# The manifest has no dedicated field for a column’s code system (today it appears only in the column description text).
# Value-level check results are in the diagnostic report and are not exposed in the manifest — the verified-facts proposal fills this gap.
ra, rb = d2_02_result(report(a)), d2_02_result(report(b))   # None if the report cannot be read
if ra is None or rb is None:
    return candidate("value-level check results unavailable — do not join just because names match")
if ra.applicability != "APPLIED" or rb.applicability != "APPLIED":
    return candidate("values were not checked against a code list")
if ra.code_list != rb.code_list:
    return exclude("checked against different code lists")
return join(evidence=[ra.match_rate, rb.match_rate, ra.code_list_version])
When the field is missing If there is no value-level check result from D2-02 (Referential integrity), the agent keeps the join only as a “candidate”. It states in the result that there is no evidence for the join.
Usability — conditions of use
Judgment question · May it be used?
Fields read dct:license · dct:rights · dct:accessRights · dpv:hasPersonalData · aird:deidentificationLevel · odrl:hasPolicy
if m["dct:accessRights"] != "PUBLIC":
    return human_review("access-restricted data")
lic = m["dct:license"]
if lic not in KR_LICENSE:                      # value list kr-license in the vocabulary
    return human_review("license outside the value list — machines cannot read its conditions")
conditions = license_conditions(lic)
# No required element covers AI training permission — read only the optional odrl:hasPolicy; do not guess from dct:rights text
policy = m.get("odrl:hasPolicy")
training_allowed = permitted_actions(policy) if policy else "unconfirmed"
return usable(conditions=conditions, training_allowed=training_allowed)
When the field is missing Whether AI training is permitted is not a required element of the standard. It can be expressed in the optional usage policy (odrl:hasPolicy). If there is no usage policy, the agent does not guess from the rights (dct:rights) text and leaves it as “unconfirmed”.
Handling information the standard does not define
The following four kinds of information are not required elements of the standard. This site recommends the following handling on the agent side.
| Information not in the required elements | Recommendation for agents |
|---|---|
| Temporal coverage · spatial coverage | Read DCAT dct:temporal · dct:spatial if present. Otherwise, mark “coverage not recorded”. If the question requires coverage, hand over to human review. |
| Whether AI training is permitted | If there is an ODRL policy (odrl:hasPolicy), read the permitted · prohibited actions. Otherwise, mark “unconfirmed”. For training use, hand over to human review. |
| Whether automated collection is permitted · version of the terms of use | If the ODRL policy has a prohibited action (odrl:prohibition), follow it. If there is no policy and the conditions of use exist only as a terms document, do not collect automatically and mark “unconfirmed”. If the effective date of the terms cannot be confirmed, hand over to human review. |
| API availability · response conformance to the spec | The agent checks these directly before calling. It keeps the check time and result as evidence for its judgment. It does not substitute values from the manifest. |
Automated-use eligibility conditions
Part 5follow-on part defines 8 data-side conditions for automated-use eligibility. The pseudocode below covers all 8 conditions. Conditions for which the standard has not yet defined fields (2 · 3 · 4) are marked “under review”. Interface · exchange conformance of the providing system is handled at a separate level.
# Automated-use eligibility — 8 data-side conditions [Part 5 Table 9-2]follow-on part
# Only conditions whose fields the standard defines are written as code. Conditions with unconfirmed fields are marked.
def eligible_for_automated_use(m, file, url):
    d = distribution(m, url)
    return all([
        m["aird:lifecycleStatus"] == "Purpose-Ready",           # 1 Purpose-Ready data
        currently_provided(m),                                   # 2 field under review
        officially_published(m),                                 # 3 field under review
        purpose_tier(m) is not None,                             # 4 property name under review — aird:purposeTier / aird:purposeReadiness
        m.get("aird:diagnosticMaturity") == "DM-2",             # 5 all required items measured
        quality_tier_at_least_minimum(m),                        # 6 at least the minimum tier set by the operating guideline
        sha256(file) == d["spdx:checksum"]["spdx:checksumValue"],  # 7 checksum matches (per distribution)
        m.get("dct:license") in KR_LICENSE and m.get("dct:rights") and m.get("dct:accessRights"),
                                                                # 8 conditions of use can be confirmed — because this is
                                                                #   automated use, read as a machine-readable license
    ])
The “under review” marks in the pseudocode are where property names · interpretations are being checked against the original text of the standard.
The shape of a manifest is in Manifest example, and the list of properties is in Metadata elements. The release status of schema files and validation tools is in Development status and upcoming releases.
Other paths · Preparing data — Writing the manifest (stage 1) · Operating guidelines — Adoption brief
Adoption brief
Contents
ContentsThis page summarizes the scope of the standard, operating guidelines, and the adoption steps for organizations considering adoption (public institutions, companies, industry associations, data platforms).
Overview
The AI-Ready Data (AIRD) standard specifies the grounds for the four judgments an AI agent makes before using data. The four judgments are fitness (Does it fit the question?), reliability (Can it be trusted?), joinability (Can it be joined?), and usability (May it be used?). The standard specifies how to record these grounds with the data in machine-readable form. Parts 1–3 are a draft standard (TTAK deliberation draft v0.95); Parts 4–5 are follow-on parts.
Background
The users of data are expanding from people to AI agents. An agent cannot verify facts that are not recorded with the data, so it guesses. We observed one public dataset with relatively complete catalog metadata. Of the 19 required metadata elements in the deliberation draft (15 for the dataset + 4 for the distribution), 10 had to be newly written. Registering data on a portal and preparing it for AI use are different tasks. Data that companies provide free of charge may have its own terms of use that prohibit redistribution or automated collection. A person reads the terms and decides, but an agent cannot check the conditions of use. Why it is needed
Obligation to apply
This standard is not an obligation under any law or regulation. The standard is not used for evaluation or for ranking organizations against each other. The Part 1–3 draft standard is in scope for establishment in December 2026; Parts 4–5 are follow-on parts. Once the established standard is published, it takes precedence.
What an adopting organization does
| Who | Tasks |
|---|---|
| Data provider | Stage 1: write metadata elements and column descriptions · Stage 2: fix the values that can be fixed and record limitations · Stage 3: only for data with a defined use purpose |
| Diagnostic tool · system | Compute scores · draft the manifest and the diagnostic report · compute checksums |
| Guideline publisher | Build an operating guideline or adopt the standard-provided operating guideline · publish the operating guideline and threshold profile |
| Organization that buys or procures data | Require a manifest and machine-readable conditions of use in contract and procurement terms Recommended |
This site recommends preparing data in this order: data with usage requests, data used in combination with other data, then the rest. Overview
Decisions
| What to decide | What the standard and operating guideline specify |
|---|---|
| Who sets the judgment criteria | Judgment criteria are set by an operating guideline that is separate from the standard. The operating guideline includes the threshold profile. The standard publishes a standard-provided operating guideline when the standard is established (expected December 2026). Organizations, institutions, and domains can build operating guidelines independently. [Part 1 7.1] |
| Roles of the standard and the operating guideline | Tier elements (the tier scheme Tier 0–4, tier names, label format, judgment procedure) follow the standard. Operational elements (threshold profile, diagnosis cycle, result validity period, appeal procedure, tool certification) are set by the operating guideline. |
| Publication and access requirements | An organization that judges and publishes tiers publishes the operating guideline it applied and makes it accessible. The tier is stated together with the identifier and version of the operating guideline. |
| Results before an operating guideline is applied | Measurement and writing the diagnostic report are possible without an operating guideline. Results without an applied operating guideline get no tier judgment (not judged: no operating guideline applied). Judgment procedure |
- Some information is not covered by the standard. Temporal and spatial coverage, whether AI training is permitted, and API availability are not required elements. A company’s own terms of use are not in the vocabulary’s list of license values (kr-license). How to record a company’s own terms of use is being reviewed together with a vocabulary revision proposal. What agents read
- Content may change. Parts 4–5 are follow-on parts. When the established standard is published, this site will be updated accordingly.
How to build an operating guideline and the publication requirements are in Building an operating guideline.
Cost and benefit
In stage 1, the data provider records descriptive information without changing data values. Stage 1 can start without special tools (checksums are computed with common tools such as sha256sum). If the existing registration system does not support entering required properties, version management, checksum generation, and manifest publication, those functions must be added.
This site’s measurement engine (experimental) shows that a manifest reduces the number of items an agent must guess. The effect on actual agent behavior and answer accuracy has not been measured yet. The effect study has not been run.
Adoption steps
- Select the target data and write the stage 1 metadata elements. Inputs are the data file and existing catalog information; the output is the manifest. Writing the manifest (stage 1)
- Learn how the diagnostic report is structured and how to read reasons for not measured. Reading the diagnostic report (stage 2)
- Check the values the operating guideline sets. Items set by the operating guideline
- Check how tiers change with threshold profile values. Tier simulation
- Build an operating guideline or adopt the standard-provided operating guideline. Building an operating guideline
Building an operating guideline
Contents
ContentsAn operating guideline is a document that holds judgment threshold values and operational matters, built separately from the standard. An organization can adopt the standard-provided operating guideline or build its own.
What the operating guideline sets and what the standard specifies
Tier elements follow the standard; operational elements are set by the operating guideline. Each column is a separate list; items on the same row are not paired.
| Set by the operating guideline (operational elements) | Specified by the standard (tier elements) |
|---|---|
| Tier band boundaries in the threshold profile | Tier scheme Tier 0–4 and tier names (Unqualified · Bronze · Silver · Gold · Platinum) [Part 2 7.1] |
| Per-dimension required pass lines, dimension weights, and weight adjustment ranges in the threshold profile | Judgment procedure: candidate tier from the minimum dimension score → pass line check → demotion by one tier if any dimension falls short [Part 2 6 · 7] |
| DM-1 evaluation coverage lower bound and indicator parameters (D3-02 label match criterion · D5-03 dummy value patterns) in the threshold profile | Definitions, measurement formulas, and the Diagnostic Maturity decision table for the 16 quality indicators [Part 2 Annex B.5] |
| Identifier, version, and activation procedure of the threshold profile | Element structure of the threshold profile [Part 2 Annex D · Table 9-3] |
| Operational matters: diagnosis cycle · result validity period · appeal procedure · tool certification [Part 1 7.1] | Tier label format Gold (Tier 3, STRUCT) [Part 1 Annex A] |
| Judgment criteria for purpose tiers · detailed pack structure | Readiness states and pack composition [Part 1 5.1 · 5.5] |
Standard-provided and organizational operating guidelines
The standard provides an operating guideline. The standard-provided operating guideline is published when the standard is established (expected December 2026). There is more than one guideline publisher. Organizations, institutions, and domains can build operating guidelines independently. [Part 1 3.20 · 3.21 · 7.1]
| Approach | What the guideline publisher does |
|---|---|
| Adopt the standard-provided operating guideline | Applies the standard-provided operating guideline as is, and states that guideline’s identifier and version with the tier |
| Adjust the standard-provided operating guideline | Adjusts the threshold profile and operational matters based on the standard-provided operating guideline, and publishes the adjusted guideline under its own identifier and version |
| Build its own operating guideline | Sets the threshold profile and operational matters directly, and publishes the guideline under its own identifier and version |
In every approach, tier elements follow the standard. The same score can yield a different tier under a different operating guideline.
Structure of the threshold profile
The threshold profile (judgment threshold values) is part of the operating guideline. It is a machine-readable file that holds the numbers adjusted during operation, such as tier bands, pass lines, and weights, with an identifier and a version. The operating guideline sets the identifier, version, and activation procedure of the threshold profile, and Part 2 Annex D specifies the structure of its elements.
Threshold profile elements — expand table (10 rows)
| Element | Obligation | Value range | Value it sets |
|---|---|---|---|
profileId | Required | URI | Profile identifier |
version | Required | SemVer | Profile version |
status | Required | OFFICIAL or EXAMPLE | Profile status |
digest | Required | SHA-256 | Hash of the profile file |
tierThresholds | Required | 4 values in 0.0–1.0 | Tier bands (Part 2 7.1) |
passLines | Required | 7 dimensions × 4 tiers | Per-dimension required pass lines (7.2) |
dimensionWeights | Required | 7 values summing to 1.00 | Dimension weights (6.3) |
weightAdjustmentRange | Required | Lower and upper bound per dimension | Weight adjustment range (6.3) |
dm1Coverage | Required | 0.0–1.0 | DM-1 evaluation coverage lower bound (8.1) |
indicatorParameters | Conditionally required | Object per indicator | D3-02 image label match criterion · D5-03 dummy value patterns |
[Part 2 Annex D Table D.1] · Machine representation: aird-threshold-profile-1.0.schema.json (Part 2 Table 9-3)
Tier labels and publication requirements
Whoever judges and publishes tiers observes the following four requirements.
- Tier label in the standard format. Write the tier in the form
Gold (Tier 3, STRUCT). Always include the data type; do not include Diagnostic Maturity (DM) in the tier label. [Part 1 Annex A] - Operating guideline identifier and version alongside. State the identifier and version of the operating guideline applied in the judgment together with the tier.
- Publication of the operating guideline and threshold profile. Publish the applied operating guideline and threshold profile so anyone can access them.
- Hash record. Record the identifier, version, and hash of the threshold profile in the diagnostic report. Data users can use the hash to verify the file used in the judgment. [Part 2 9.1]
Example threshold profile (Part 2 Appendix I)
Example Example threshold profile · status EXAMPLE · not used for tier judgment · source: draft standard (TTAK deliberation draft v0.95) [Part 2 Appendix I Tables I.1 – I.4]
The numbers in Part 2 Appendix I are not values with an established academic basis. The example threshold profile is a file that records the Appendix I numbers in the Annex D structure, and its status is EXAMPLE. The example threshold profile is used only for provisional calculation and tool development, not for tier judgment. All values in the tables for tier bands, per-dimension required pass lines, dimension weights, and other numbers are example values.
Tier bands (minimum dimension score) — example
| Tier | Tier name | Minimum dimension score |
|---|---|---|
| Tier 4 | Platinum | 0.95 or higher |
| Tier 3 | Gold | 0.85 or higher, below 0.95 |
| Tier 2 | Silver | 0.70 or higher, below 0.85 |
| Tier 1 | Bronze | 0.50 or higher, below 0.70 |
| Tier 0 | Unqualified | Below 0.50, or a pass line not met |
Tier 0 applies in two cases. First, when the minimum dimension score is below 0.50. Second, when the candidate tier was Tier 1 but a dimension fell short of the Tier 1 pass line, so the result was demoted by one tier. [Part 2 7.3]
Per-dimension required pass lines — example
Per-dimension required pass lines — expand table (7 rows)
| Dimension | Tier 1 | Tier 2 | Tier 3 | Tier 4 |
|---|---|---|---|---|
| D1 Completeness | 0.60 | 0.75 | 0.85 | 0.95 |
| D2 Consistency | 0.50 | 0.70 | 0.80 | 0.90 |
| D3 Accuracy | 0.65 | 0.80 | 0.90 | 0.95 |
| D4 Timeliness | 0.40 | 0.60 | 0.75 | 0.85 |
| D5 Validity | 0.60 | 0.75 | 0.85 | 0.95 |
| D6 Uniqueness | 0.60 | 0.75 | 0.85 | 0.95 |
| D7 Machine readability | 0.80 | 0.90 | 0.95 | 1.00 |
Dimension weights — example
Dimension weights — expand table (7 rows)
| Dimension | Example weight | Adjustment range |
|---|---|---|
| D1 Completeness | 0.18 | 0.10 – 0.25 |
| D2 Consistency | 0.10 | 0.07 – 0.18 |
| D3 Accuracy | 0.24 | 0.17 – 0.32 |
| D4 Timeliness | 0.10 | 0.05 – 0.18 |
| D5 Validity | 0.13 | 0.08 – 0.20 |
| D6 Uniqueness | 0.12 | 0.08 – 0.18 |
| D7 Machine readability | 0.13 | 0.08 – 0.20 |
Other values — example
| Item | Example value |
|---|---|
| DM-1 evaluation coverage lower bound (DM-1 is not judged with the example threshold profile) | 0.50 |
| D3-02 image overlap ratio | 0.5 or higher |
| D5-03 dummy value patterns | 999999, 99999999, 9999, -1, -9, 0000 |
Purpose-specific criteria
The judgment criteria for the purpose tier are set by the operating guideline. A purpose tier is judged only when an operation-layer profile in registered status (Registered) exists for the use purpose type. For a type without a registered profile, no purpose tier is judged (PROFILE_NOT_REGISTERED). In that case, data prepared for a purpose (Purpose-Ready) is not reached either. There are four profile statuses: Draft · Candidate · Registered · Deprecated. [Part 1 5.6 · Table 5-3 · Part 3 8.2 · Annex C.19]
Without an operating guideline
Measurement and writing the diagnostic report are possible without an operating guideline. The diagnostic tool measures D5-03 (Statistical plausibility) provisionally with the example patterns in Part 2 Appendix I and records the evaluation status as PROVISIONAL. Results without an applied operating guideline get no tier judgment (not judged: no operating guideline applied). After an operating guideline is applied, if its D5-03 patterns differ from the example, measure again and issue a new diagnostic report. Reuse an existing diagnostic report as is only when the target version, measurement rules, threshold profile, and measurement time are all the same. The steps for Diagnostic Maturity and tier judgment are in Judgment procedure.
Other paths · Preparing data — Writing the manifest (stage 1) · For agents — What agents read
Key concepts
This page defines four groups of concepts needed to read the standard: readiness states and decision gates, three judgments that are not combined, outputs, and roles.
Readiness states and decision gates
Data is prepared in three stages. Each stage ends with a decision gate. When data passes a decision gate, its readiness state transitions. Data that does not pass is not rejected; it is improved and checked again. AI-ready data means a state of Quality-Ready or higher. [Part 1 3.1 · 5.1]
| Plain term | Standard term | Explanation | Basis |
|---|---|---|---|
| Findable data | readiness state Discoverable | The state of having the required metadata elements of the discovery layer. The result of stage 1. | [Part 1 5.2] |
| Quality-checked data | readiness state Quality-Ready | The state in which quality has been measured and the transition conditions at G2 (DM-2 · Tier 1 or higher · operating guideline applied) are met. The result of stage 2. | [Part 1 5.2] |
| Purpose-prepared data | readiness state Purpose-Ready | The state of being prepared to the criteria of a specific use purpose. The result of stage 3. | [Part 1 5.2] |
| Suspended state | readiness state Stale | The state in which a readiness state is suspended because of an update delay or a checksum mismatch. Restored after update and revalidation. | [Part 1 5.2] |
| Checkpoint | decision gate Decision Gate (G1 · G2 · G3) | The point at the end of each stage where it is judged whether data can transition to the next state. | [Part 1 5.2 · Part 4 6–8]follow-on part |
The details of the Quality-Ready transition conditions are in Judgment procedure.
Three judgments — not combined
Quality judgment is divided into three judgments. The diagnostic tool records the result of each judgment separately.
| Judgment | Question it answers | Form | Basis for the decision |
|---|---|---|---|
| Quality tier (Q-Tier) | Level of measured quality | Tier 0–4 · e.g. Gold (Tier 3, STRUCT) | Minimum dimension score · threshold profile of the operating guideline |
| Diagnostic Maturity (DM) | How much of the required indicators is measured | DM-0 · DM-1 · DM-2 | Diagnostic Maturity decision table (Judgment procedure) |
| Purpose tier (P-Tier) | Level of preparation for a specific purpose | e.g. P-Tier 2 (KG) | The purpose profile registered for that purpose |
Even with high measured scores, the quality tier is not judged unless Diagnostic Maturity is DM-2. The two values cannot replace each other. When a judgment cannot be made, the diagnostic tool records “not judged” and the reason. It does not substitute a score of 0 or the lowest tier (Status and judgment values).
| Plain term | Standard term | Explanation | Basis |
|---|---|---|---|
| 7 dimensions | quality dimension Quality Dimension (D1–D7) | Completeness · consistency · accuracy · timeliness · validity · uniqueness · machine readability. | [Part 2 5.2] |
| Quality tier | quality tier Q-Tier (aird:qualityTier, Tier 0–4) | The quality level judged with the threshold profile of the operating guideline. Not judged without an applied operating guideline. | [Part 2 7.1 · Part 3 C.6] |
| Measurement completeness | Diagnostic Maturity Diagnostic Maturity (DM-0 · DM-1 · DM-2) | A graded judgment, decided with a decision table, of how far the required indicators have been measured. Not combined with quality scores. | [Part 2 8.1 · Annex B.5] |
| Measured share | evaluation coverage Evaluation Coverage | A value from 0 to 1: the sum of statusFactor over applicable required formal indicators divided by the number of those indicators. Used for the DM-1 judgment. | [Part 2 Annex A.3 · B.5] |
| Minimum indicators | minimum measurable indicator Minimum Measurable Indicator (MMI) | The four indicators that are the entry requirement for diagnosis (D5-03 · D6-01 · D7-01 · D7-02). The indicators with the lowest input requirements. | [Part 2 Annex A.2] |
| Lowest score | minimum dimension score Minimum Dimension Score | The lowest of the seven dimension scores. The starting point for finding the candidate tier. The average is not used for tier judgment. | [Part 2 6.2] |
| One tier down | demotion Demotion | Lowering the candidate tier by one when a dimension falls short of the per-dimension required pass line set by the threshold profile of the operating guideline. | [Part 2 7.3] |
| Ready for the next stage | transition eligibility Transition Eligibility | The state of having both Diagnostic Maturity DM-2 and a quality tier of Tier 1 or higher judged under an operating guideline. | [Part 2 7.5] |
Outputs
Judgment results are kept as documents separate from the data. A new manifest is issued for each version. A new diagnostic report is created for each measurement. The manifest points to the data files by address and checksum.
| Plain term | Standard term | Explanation | Basis |
|---|---|---|---|
| Data description | manifest Manifest | A document that describes a dataset in machine-readable form. Issued anew for each version and points to the previous version. | [Part 3] |
| Diagnostic report | diagnostic report Diagnostic Report | A quality measurement document (JSON) created anew for each measurement. This site calls it the “diagnostic report”. | [Part 2 9] |
| Per-purpose operation file | operation file Operation File | A preparation output created once for each use purpose type. | [Part 3 8] |
| Bundle | pack Pack | The unit of distribution. A Quality-Ready pack contains the manifest, the diagnostic report, and the pack manifest; a Purpose-Ready pack adds the operation files. Data files are not included in the pack but are referenced by address and SHA-256 checksum. The detailed structure is set by the operating guideline (Packaging and distribution). | [Part 1 3.15 · 5.5 · Part 3 5.1] |
Roles
Three parties share the work. The data provider prepares the materials and checks the results. The diagnostic tool computes scores and computes tiers with the threshold profile of the operating guideline. The guideline publisher builds and publishes the operating guideline. There is more than one guideline publisher. The standard publishes a standard-provided operating guideline at establishment (expected December 2026), and organizations, institutions, and domains can build operating guidelines independently. The division of work by stage is in the workflow on each guide page (e.g. Measuring quality (stage 2)).
| Who | Does | Does not |
|---|---|---|
| Data provider | Prepares and checks materials · fixes the values that can be fixed · records limitations that cannot be fixed | Compute scores · compute tiers · decide judgment threshold values |
| Diagnostic tool | Computes scores · computes tiers with the threshold profile of the operating guideline · drafts the diagnostic report and manifest · computes checksums | Decide judgment threshold values · judge limitations |
| Guideline publisher (standard-provided operating guideline · organization · institution · domain) | Builds, publishes, and updates the operating guideline and threshold profile · publishes tier and transition judgments under the applied operating guideline | Write data · fix values |
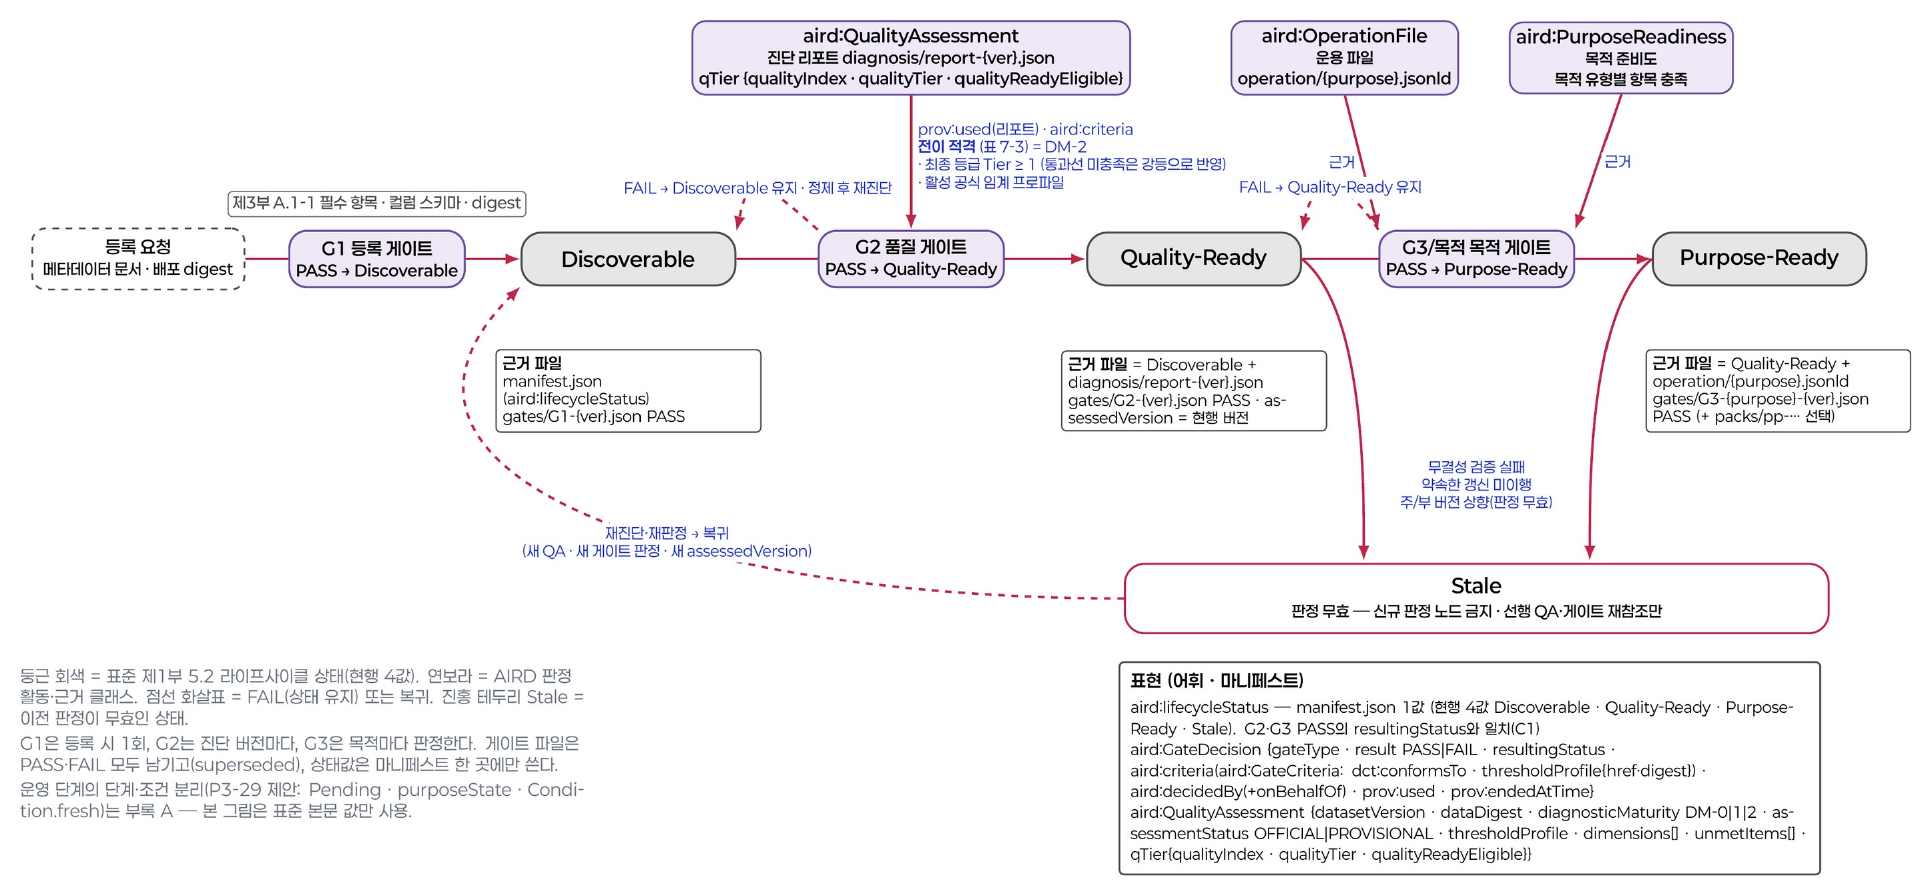
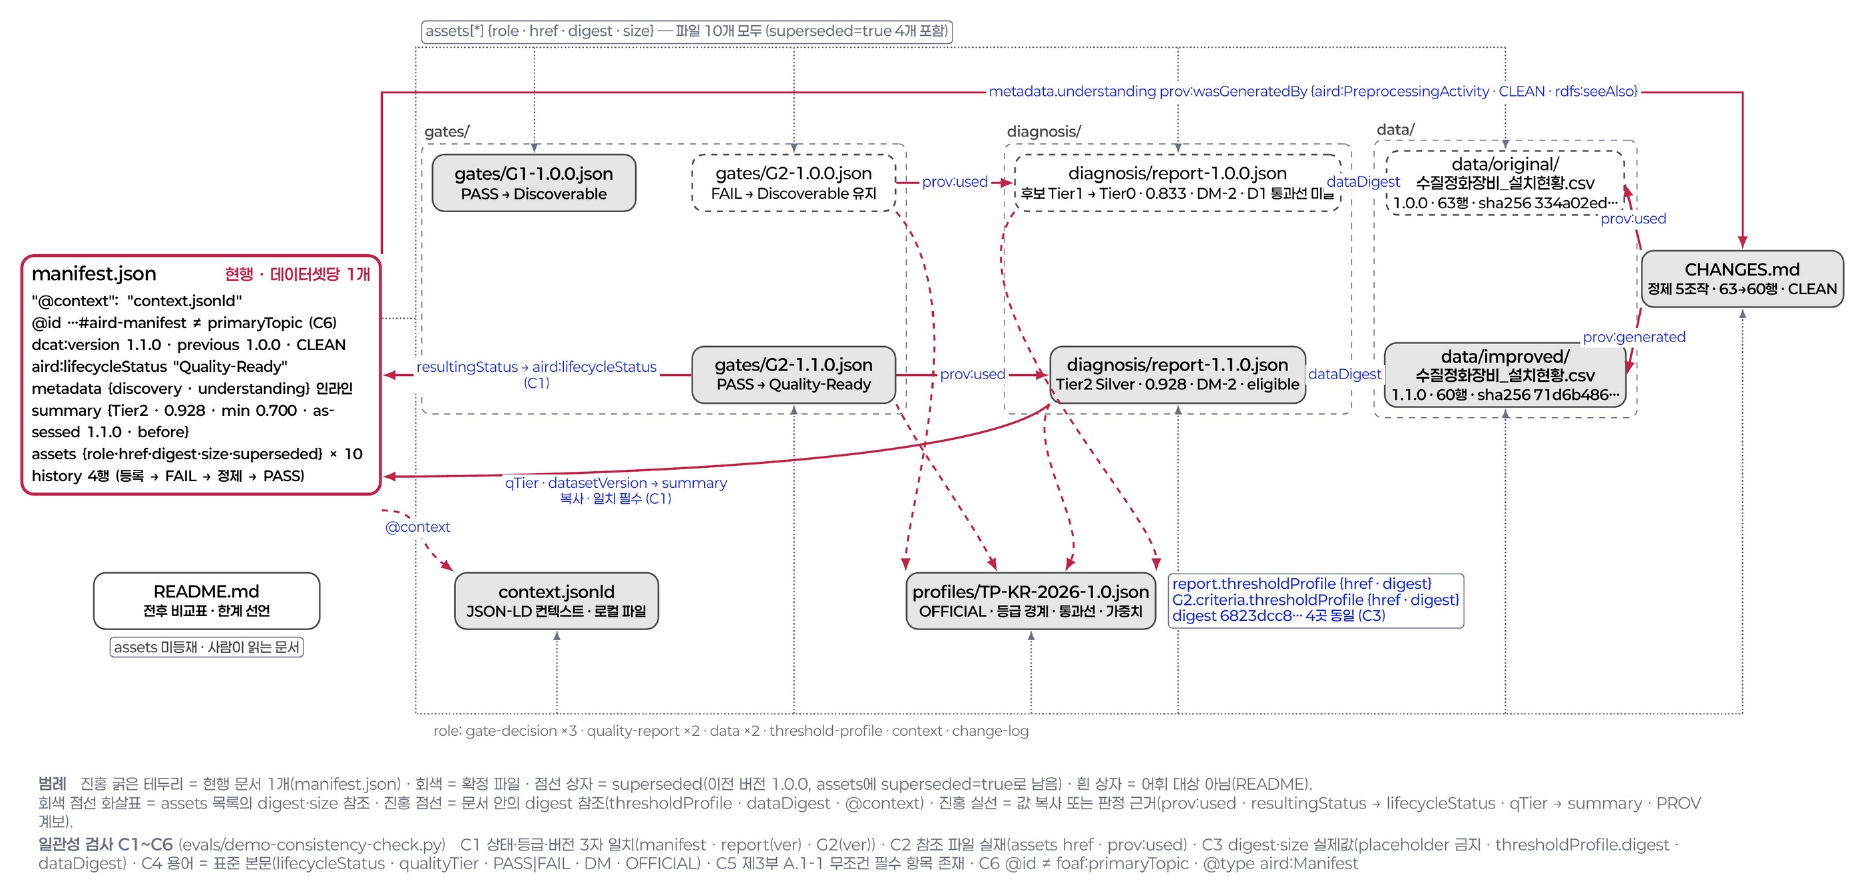
Judgment procedure
Contents
ContentsThe diagnostic tool judges Diagnostic Maturity and the quality tier by applying, in turn, a decision table and the threshold profile of an operating guideline.
The diagnostic tool does the calculation. The judgment criteria are set by an operating guideline that is separate from the standard. Data providers do not perform this procedure themselves.
Diagnostic Maturity decision table
Diagnostic Maturity (DM) shows how far the required indicators have been measured. The diagnostic tool applies the table below from the top and ends the judgment at the first row that is met. [Part 2 Annex B.5 Table B.4]
| Order | Condition | Judgment |
|---|---|---|
| 1 | Diagnosis status exception: SCHEMA_ONLY (empty file) or FILE_BROKEN (corrupted file) | Not judged |
| 2 | All applicable required formal indicators are APPLIED | DM-2 |
| 3 | All applicable minimum measurable indicators (MMI) are APPLIED · evaluation coverage is at or above the operating guideline’s lower bound | DM-1 |
| 4 | All applicable MMIs are APPLIED | DM-0 |
| 5 | All other cases | DM-0 not met |
- There are four MMIs: D5-03 · D6-01 · D7-01 · D7-02. Only those that apply to the data type are counted.
- If any required formal indicator is only partially measured (
PARTIALLY_APPLIED), DM-2 is not met.
Evaluation coverage
Evaluation coverage is a value from 0 to 1 used to judge DM-1. [Part 2 Annex A.3 · B.5]
Evaluation coverage = Σ statusFactor(applicable required formal indicators) / n(required formal indicators excluding NOT_APPLICABLE)
- Numerator: the sum of statusFactor over the applicable required formal indicators. statusFactor is a value fixed for each applicability status of an indicator (see the indicator applicability table in Status and judgment values).
- Denominator: the number of required formal indicators, excluding
NOT_APPLICABLE. - Lower bound: set by the threshold profile of the operating guideline.
Example STRUCT (tabular) data has 13 required formal indicators. If one of them is NOT_APPLICABLE, the denominator is 12. If the statusFactor sum is 7 (for example, 7 APPLIED and the rest PRECONDITION_UNMET), evaluation coverage is 7/12 ≈ 0.58. Whether DM-1 is met is judged by comparing this value with the operating guideline’s lower bound.
Measurement without an operating guideline
Measurement works even without an operating guideline. D5-03 (Statistical plausibility) takes its dummy-value patterns from the threshold profile of the operating guideline. Without an operating guideline, the diagnostic tool measures D5-03 provisionally with the example patterns in Part 2 Appendix I and records the evaluation status as PROVISIONAL. [Part 2 5.1 · Annex A.4.1 · Appendix I]
D6-01 (Uniqueness) has no precondition. If there is no identifying column, the diagnostic tool counts fully identical records across the combination of all columns. All four MMIs (D5-03 · D6-01 · D7-01 · D7-02) can therefore be measured from the file alone, and DM-0 in row 4 of the decision table is met.
- DM-1 can only be judged with the operating guideline’s lower bound for evaluation coverage. Without an operating guideline, DM-1 is not judged.
- The status of the example threshold profile (Appendix I) is
EXAMPLE. The example threshold profile is used for provisional calculation and tool development, not for tier judgment. - The quality tier is judged only when an operating guideline is applied. The operating guideline provided with the standard is to be published when the standard is established (expected December 2026). Organizations, institutions and domains can build their own operating guidelines and judge with them. [Part 1 7.1]
Reach by data type
The table below shows the Diagnostic Maturity each data type reaches without an operating guideline. Without an operating guideline, the quality tier is “Not judged: no operating guideline applied” regardless of Diagnostic Maturity.
| Data type | Required formal indicators | Diagnostic Maturity without an operating guideline | Reason |
|---|---|---|---|
STRUCT tabular | 13 | DM-0 (provisional) | D5-03 measured provisionally with example patterns |
TSERIES time series | 13 | DM-0 (provisional) | D5-03 measured provisionally with example patterns |
TEXT documents | 5 | DM-2 (when all 5 required formal indicators are measured) | If all 5 required formal indicators are APPLIED, row 2 of the decision table is met |
PT instruction–response pairs | 8 | DM-0 | D3-02 (Label accuracy) needs expert review results |
IMAGE images | 3 | DM-0 | D3-02 (Label accuracy) needs expert review results |
Without a lower bound for evaluation coverage, DM-1 is not judged for any data type.
Tier judgment steps
The diagnostic tool first checks two preconditions. If they are not met, it does not judge a tier and records the reason.
| Precondition | Record when not met |
|---|---|
| Operating guideline applied | Not judged: no operating guideline applied |
| Diagnostic Maturity DM-2 | Not judged: below DM-2 |
When both preconditions are met, the diagnostic tool judges the tier in the order below. [Part 2 6 · 7]
- Find the minimum dimension score. Input: the seven dimension scores in the diagnostic report. Output: the lowest dimension score. [Part 2 6.2]
- Set the candidate tier. Input: the minimum dimension score · the tier bands of the threshold profile. Output: the tier of the band that contains the minimum dimension score (candidate tier).
- Check the required pass line per dimension. Input: the seven dimension scores · the per-dimension required pass lines of the threshold profile. Output: the list of dimensions below their pass line.
- Demotion. If any dimension falls short, the candidate tier is lowered by one tier. Output: the demoted tier and the reason for demotion. [Part 2 7.3]
- Record the final tier. Output: the final tier (for example,
Gold (Tier 3, STRUCT)) and the identifier · version of the operating guideline applied.
- Averages (simple or weighted) are not used in tier judgment.
- Tier bands and per-dimension required pass lines are set by the threshold profile of the operating guideline. The items of a threshold profile are listed in Building an operating guideline.
- Tier names: Tier 0 Unqualified · Tier 1 Bronze · Tier 2 Silver · Tier 3 Gold · Tier 4 Platinum.
Quality-Ready transition conditions
At decision gate G2, data transitions to the Quality-Ready state when all of the conditions below are met. [Part 2 7.5]
- Diagnostic Maturity DM-2
- Quality tier Tier 1 or higher
- Threshold profile of an operating guideline applied
- Transition judged at decision gate G2
States and decision gates are defined in Key concepts.
Tier labels
| Kind | Format | Example |
|---|---|---|
| Quality tier | <tier name> (Tier N, <data type>[, additional status]) | Gold (Tier 3, STRUCT) |
| Purpose tier | P-Tier N (<use purpose type>) | P-Tier 2 (KG) |
- Never use a tier name on its own. Always state the data type with it. [Part 1 Annex A]
- Do not drop the
P-prefix from a purpose tier. - Diagnostic Maturity (DM) is not part of the tier label. It is recorded as a separate item in the diagnostic report.
- A tier always carries the identifier · version of the operating guideline applied.
Glossary
Contents
ContentsA list that pairs the standard’s terms with the plain terms used on this site. The explanations are not normative definitions; the definitions are in the “Terms and definitions” clause of each part.
Readiness states and decision gates
| Standard term | Plain term | Explanation | Clause |
|---|---|---|---|
| AI-Ready Data (AIRD) Korean: AI 레디 데이터 | AI-ready data (AIRD, pronounced “aird”) | Data that records, in machine-readable form alongside the data, the facts an agent uses for its judgments, and that has reached the Quality-Ready state or higher. The abbreviation AIRD is pronounced “aird”. | [Part 1 3.1] |
| Discoverable Korean: 디스커버러블 | Findable data | The state in which the required metadata elements of the discovery layer are in place. The result of stage 1. | [Part 1 5.2] |
| Quality-Ready Korean: 퀄리티 레디 | Quality-checked data | The state with Diagnostic Maturity DM-2 and a tier of Tier 1 or higher judged with an operating guideline. The result of stage 2. | [Part 1 5.2] |
| Purpose-Ready Korean: 펄포즈 레디 | Data prepared for a purpose | The state of being prepared to the criteria of a specific use purpose. The result of stage 3. | [Part 1 5.2] |
| Stale Korean: 스테일 | Suspended state | The state in which a readiness state is suspended because of an update delay or a checksum mismatch. The data returns to its state after it is updated and revalidated. | [Part 1 5.2] |
| Decision gate (G1 · G2 · G3) Korean: 결정 게이트 | Checkpoint | The point at the end of each stage where it is judged whether the data can transition to the next state. | [Part 1 5.2 · Part 4 6–8]follow-on part |
Outputs
| Standard term | Plain term | Explanation | Clause |
|---|---|---|---|
| Manifest Korean: 마니페스트 | Data description | A document that describes a dataset in machine-readable form. A new one is issued for each version and points to the previous version. | [Part 3] |
| Diagnostic report Korean: 진단 리포트 | Results report | A JSON document created anew at each measurement. This site calls it the “diagnostic report”. | [Part 2 9] |
| Operation file Korean: 운용 파일 | Per-purpose operation file | A preparation output created separately for each use purpose. | [Part 3 8] |
| Pack Korean: 팩 | Bundle | The unit of distribution. A Quality-Ready pack consists of the manifest · diagnostic report · pack manifest; a Purpose-Ready pack adds operation files. Data files are not put in the pack; they are referenced by address and SHA-256 checksum. | [Part 1 3.15 · 5.5 · Part 3 5.1] |
Quality judgment
| Standard term | Plain term | Explanation | Clause |
|---|---|---|---|
| Quality dimension (D1–D7) Korean: 품질 차원 | Seven dimensions | Completeness · Consistency · Accuracy · Timeliness · Validity · Uniqueness · Machine readability. | [Part 2 5.2] |
| Quality tier (Q-Tier, aird:qualityTier, Tier 0–4) Korean: 품질 등급 | Quality tier | The quality level judged with the threshold profile of an operating guideline. Not judged when no operating guideline is applied. | [Part 2 7.1 · Part 3 C.6] |
| Diagnostic Maturity (DM-0 · DM-1 · DM-2) Korean: 진단 성숙도 | Measurement completeness | A graded judgment, made with a decision table, of how far the required indicators have been measured. It is not added to quality scores. | [Part 2 8.1 · Annex B.5] |
| Diagnostic Maturity decision table Korean: 측정 완성도 결정표 · Table B.4 | Decision table | A five-row table that determines Diagnostic Maturity. Reading from the top, the first row that is met is the result. The full table is in Judgment procedure. | [Part 2 Annex B.5 Table B.4] |
| Evaluation coverage Korean: 평가 범위 | Measurement coverage | A value from 0 to 1: the sum of statusFactor over the applicable required formal indicators divided by the number of indicators. For DM-1 it is compared with the operating guideline’s lower bound. | [Part 2 Annex A.3 · B.5] |
| Minimum measurable indicator (MMI) Korean: 최소 측정 가능 지표 | Minimum indicators | The four indicators that are the entry requirement for diagnosis (D5-03 · D6-01 · D7-01 · D7-02). They need the least input. Only those that apply to the data type are measured. | [Part 2 Annex A.2] |
| Minimum dimension score Korean: 최소 차원 점수 | Lowest score | The lowest of the seven dimension scores. The starting point for finding the candidate tier. Averages are not used in tier judgment. | [Part 2 6.2] |
| Demotion Korean: 강등 | One-tier drop | Moving down one tier from the candidate tier because a dimension falls below its required pass line in the threshold profile. | [Part 2 7.3] |
| Transition eligibility Korean: 전이 적격성 | Ready to move on | The state of having both Diagnostic Maturity DM-2 and a tier of Tier 1 or higher judged with an operating guideline. | [Part 2 7.5] |
Use purposes
| Standard term | Plain term | Explanation | Clause |
|---|---|---|---|
| Purpose tier (P-Tier, aird:purposeTier, P-Tier 1–3) Korean: 목적 등급 | Purpose tier | The readiness level judged against the criteria registered for each use purpose. | [Part 4 9 · Part 3 C.7]follow-on part |
Operating guidelines
| Standard term | Plain term | Explanation | Clause |
|---|---|---|---|
| Operating guideline | Judgment criteria document | A document that holds the judgment criteria. The standard provides one, and organizations, institutions and domains can build their own independently. The operating guideline provided with the standard is to be published when the standard is established (expected December 2026). It holds the threshold profile and operational matters (diagnosis cycle · result validity period · objection procedure · tool certification). | [Part 1 7.1] |
| Threshold profile Korean: 임계 프로파일 | Judgment thresholds | The values that set weights · tier bands · pass lines · lower bounds · indicator parameters. Part of an operating guideline. Its status is OFFICIAL or EXAMPLE; EXAMPLE is not used for tier judgment. | [Part 2 Annex D · Table 9-3] |
| Guideline publisher | Organization that builds and issues a guideline | The organization, institution or domain that builds and issues an operating guideline. There is more than one publisher. Whoever judges and publishes a tier also publishes the operating guideline applied and states its identifier · version with the tier. | — |
| Registered profile Korean: 등록 상태 프로파일 | Per-purpose criteria | The judgment criteria registered for each use purpose. A purpose tier is not judged before the criteria are registered. | [Part 3 8.2 · Part 4 14]follow-on part |
Standard documents
| Standard term | Plain term | Explanation | Clause |
|---|---|---|---|
| Deliberation draft (TTAK deliberation draft v0.95) Korean: 심의본 | Draft standard (TTAK deliberation draft v0.95) | The draft standard comprising Part 1 “Overview and framework” · Part 2 “Quality measurement and tiering” · Part 3 “Dataset description schema and application profile”. It was proposed to TTA on 2026-05-13 and is under review at regular meetings. It focuses on the required elements. | — |
| AIRD vocabulary (v0.10.5) Korean: 어휘표 | AIRD vocabulary v0.10.5 | The full list of elements, including external vocabularies. It matches the deliberation draft: the draft focuses on the required elements, and the vocabulary is the full list. | — |
Data types
| Standard term | Plain term | Explanation | Clause |
|---|---|---|---|
| Structured (STRUCT) Korean: 정형 | Tabular | Data with rows and columns and a defined data type for each column | [Part 1 5.6 Table 5-5] |
| Time series (TSERIES) Korean: 시계열 | Time series | Data that records values in time order. A special case of tabular data | [Part 1 5.6 Table 5-5] |
| Text (TEXT) Korean: 텍스트 | Documents | Data made of natural-language sentences and documents | [Part 1 5.6 Table 5-5] |
| Image (IMAGE) Korean: 이미지 | Images | Image files (for example, photos · drawings) | [Part 1 5.6 Table 5-5] |
| Paired text (PT) Korean: 페어형 텍스트 | Instruction–response pairs | Text data made of instruction–response pairs or preference pairs | [Part 1 5.6 Table 5-5 (deliberation draft)] |
Publishers and provision modes (site classification)
| Standard term | Plain term | Explanation | Clause |
|---|---|---|---|
| Public-sector data Korean: 공공 데이터 · publisher_sector: public | Data issued by public institutions | Data issued or provided by public institutions as defined in the Korean Public Data Act. It is classified by publisher, not by the subject the data covers. One of the targets of the standard | — |
| Enterprise data Korean: 기업 데이터 · publisher_sector: enterprise | Data issued by companies | Data that companies create or provide. If a company creates it and a public platform publishes it, it is classified by its creator (dct:creator, the company) | — |
| Non-profit data Korean: 민간 비영리 데이터 · publisher_sector: nonprofit | Data from associations · foundations · communities | Data issued by industry associations · foundations · communities | — |
| Open Korean: 개방 · provision_mode: open_license | Open under an open license | Provision that states its conditions of use with a standard license value (for example, KOGL · CC). Machines can read the conditions of use | — |
| Free access Korean: 무료 제공 · provision_mode: free_access | Free, but with its own terms | No charge, but its own terms of use apply. The terms may restrict redistribution or automated collection, and machines cannot read the conditions of use. Different from open | — |
| Commercial Korean: 유상 제공 · provision_mode: commercial | Contract · sale | Provided by contract · pay-per-use · sale on a data exchange. The price is recorded with dcatkr:fee · sc:offers | [vocabulary 1.4.5 · 1.4.6] |
Tier label rules
| Kind | Format | Example |
|---|---|---|
| Quality tier | <tier name> (Tier N, <data type>[, additional status]) | Gold (Tier 3, STRUCT) |
| Purpose tier | P-Tier N (<use purpose type>) | P-Tier 2 (KG) |
Tier names: Tier 0 Unqualified · Tier 1 Bronze · Tier 2 Silver · Tier 3 Gold · Tier 4 Platinum
- Never use a tier name on its own. Always state the data type with it.
- Do not drop the P- prefix from a purpose tier.
- Diagnostic Maturity (DM) is not part of the tier label; it is recorded as a separate item in the diagnostic report.
- State the identifier · version of the operating guideline applied next to the tier label, not inside the label format itself (for example, Gold (Tier 3, STRUCT) · operating guideline example-guideline 1.0).
[Part 1 Annex A]
Metadata elements
Contents
Contents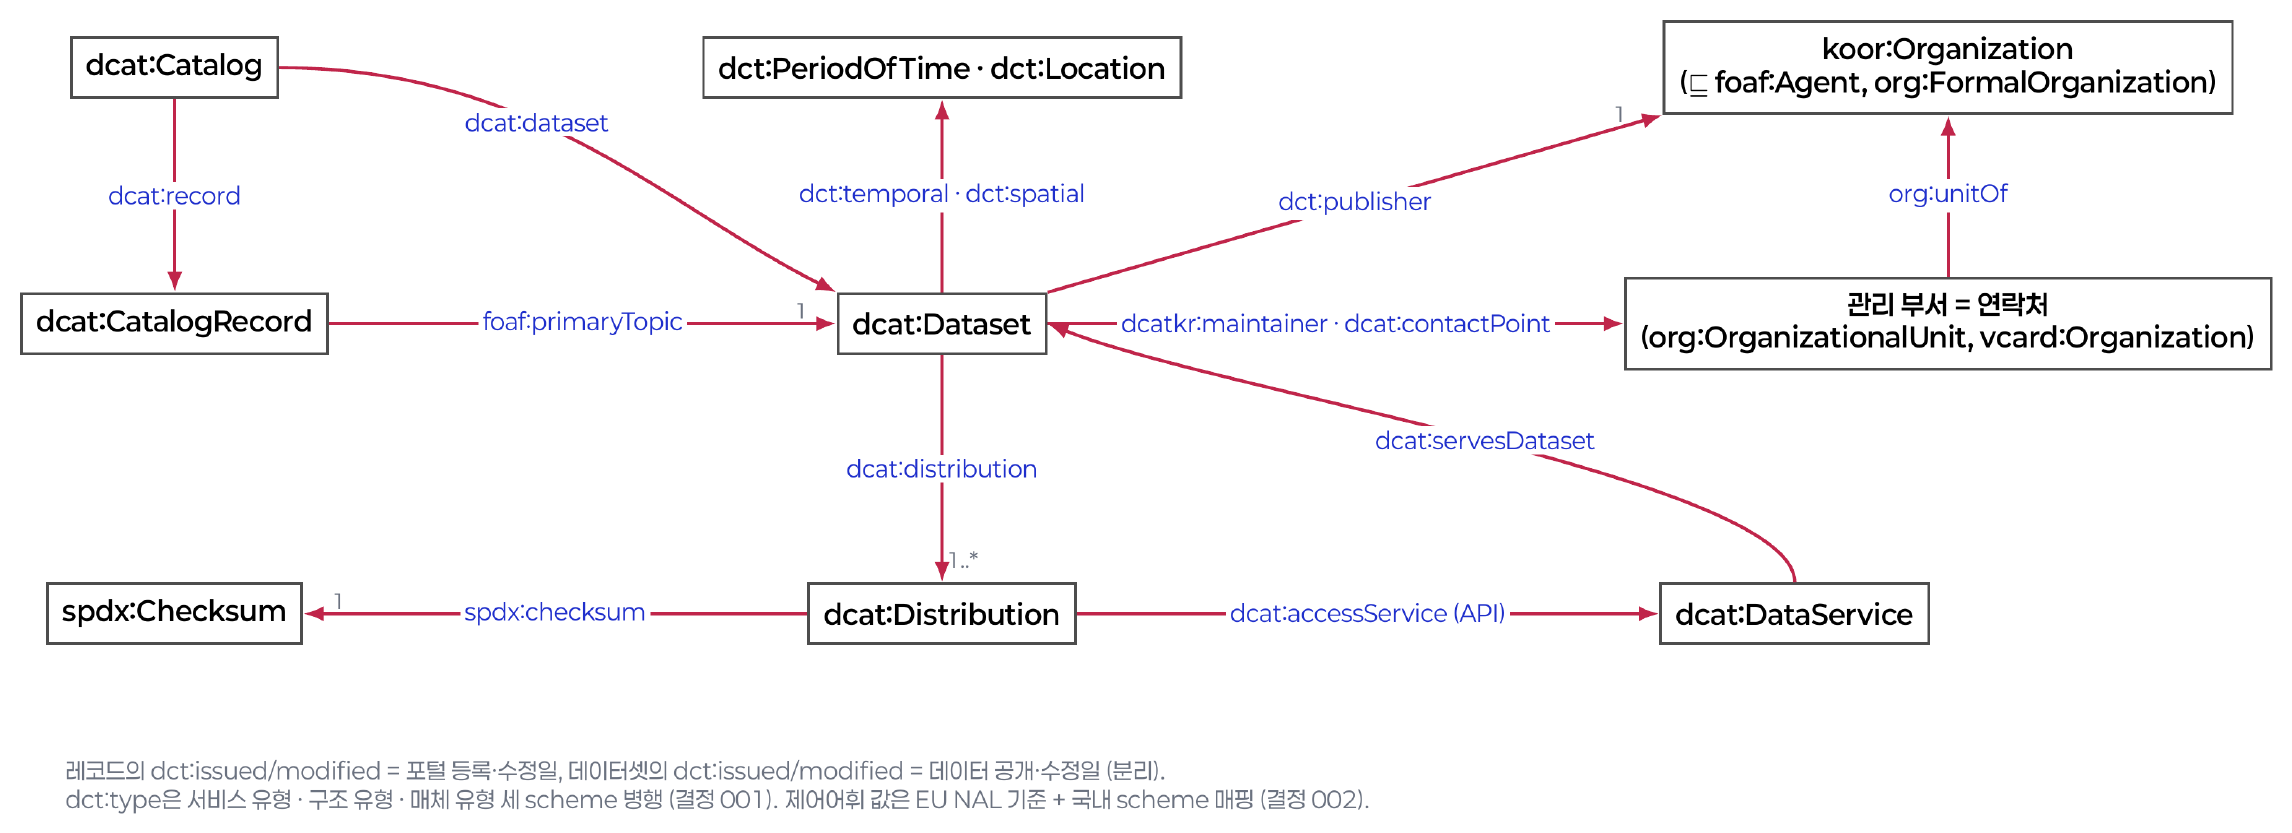
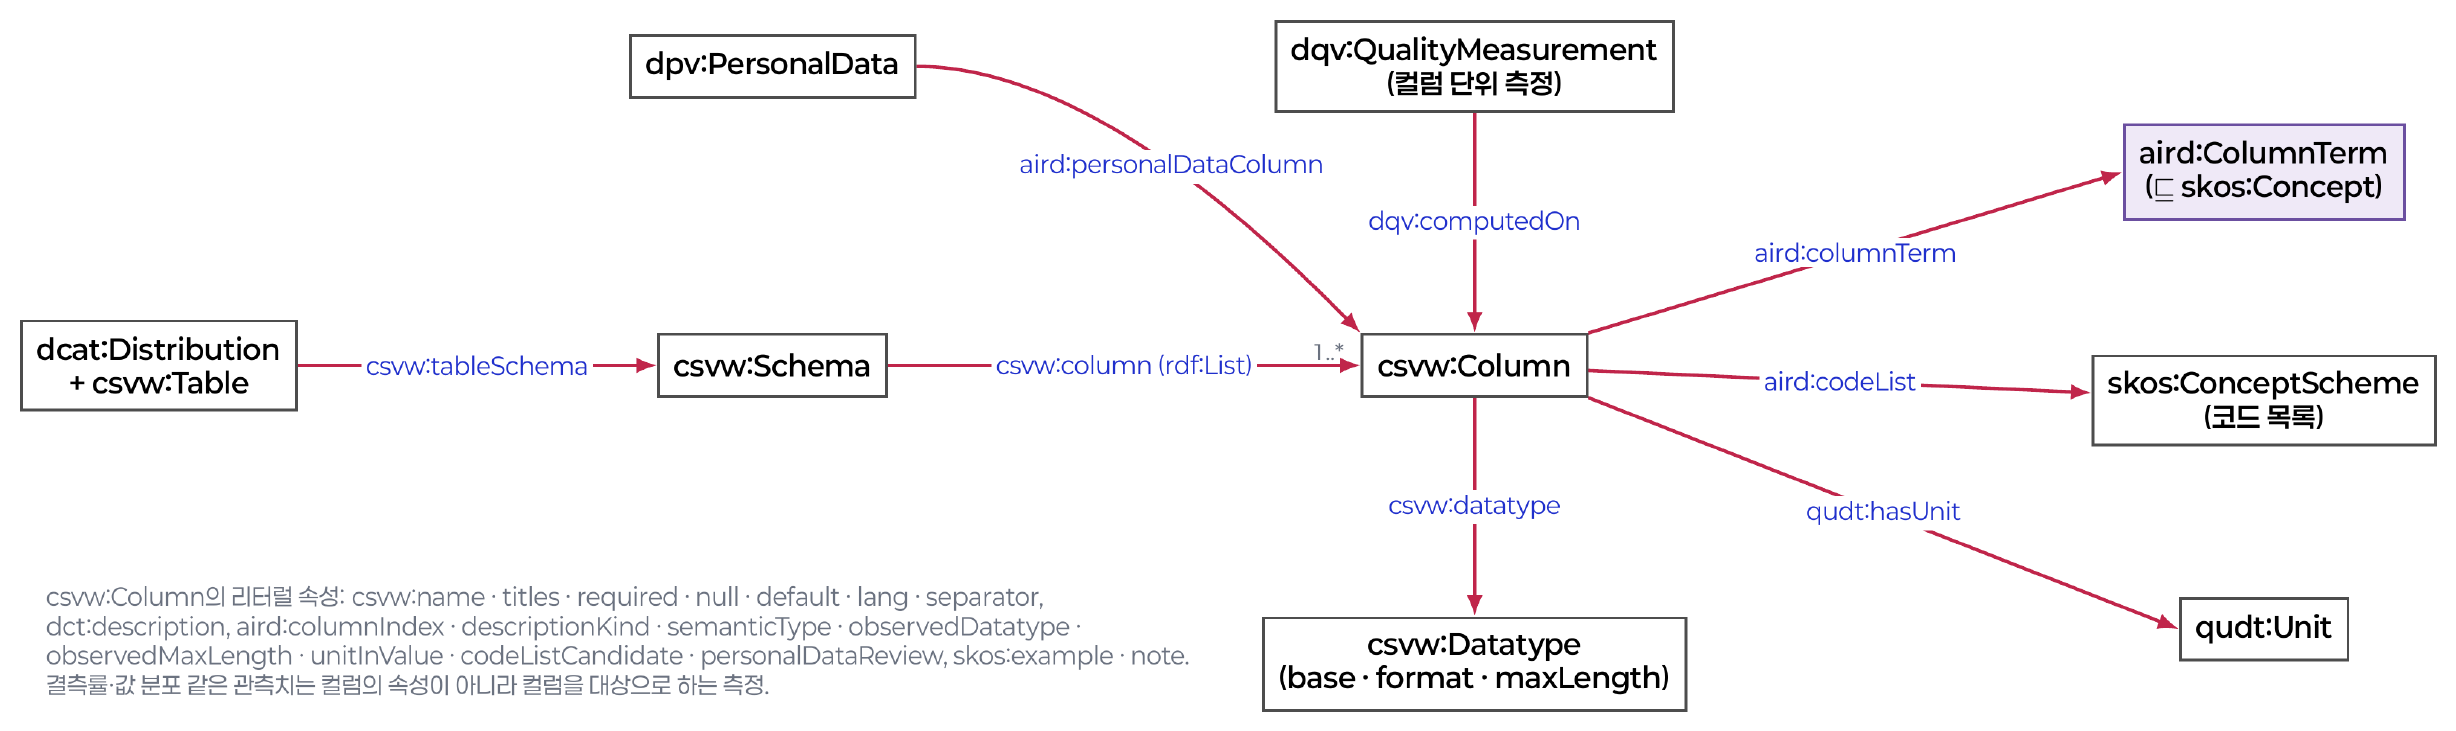
csvw:tableSchema) of structured data is described on the distribution (csvw:Table). Each column has a name, a datatype and a description, and AIRD extends the elements (for example, unit and code system).Source: AIRD information model v0.10.5, page 22 · click for full size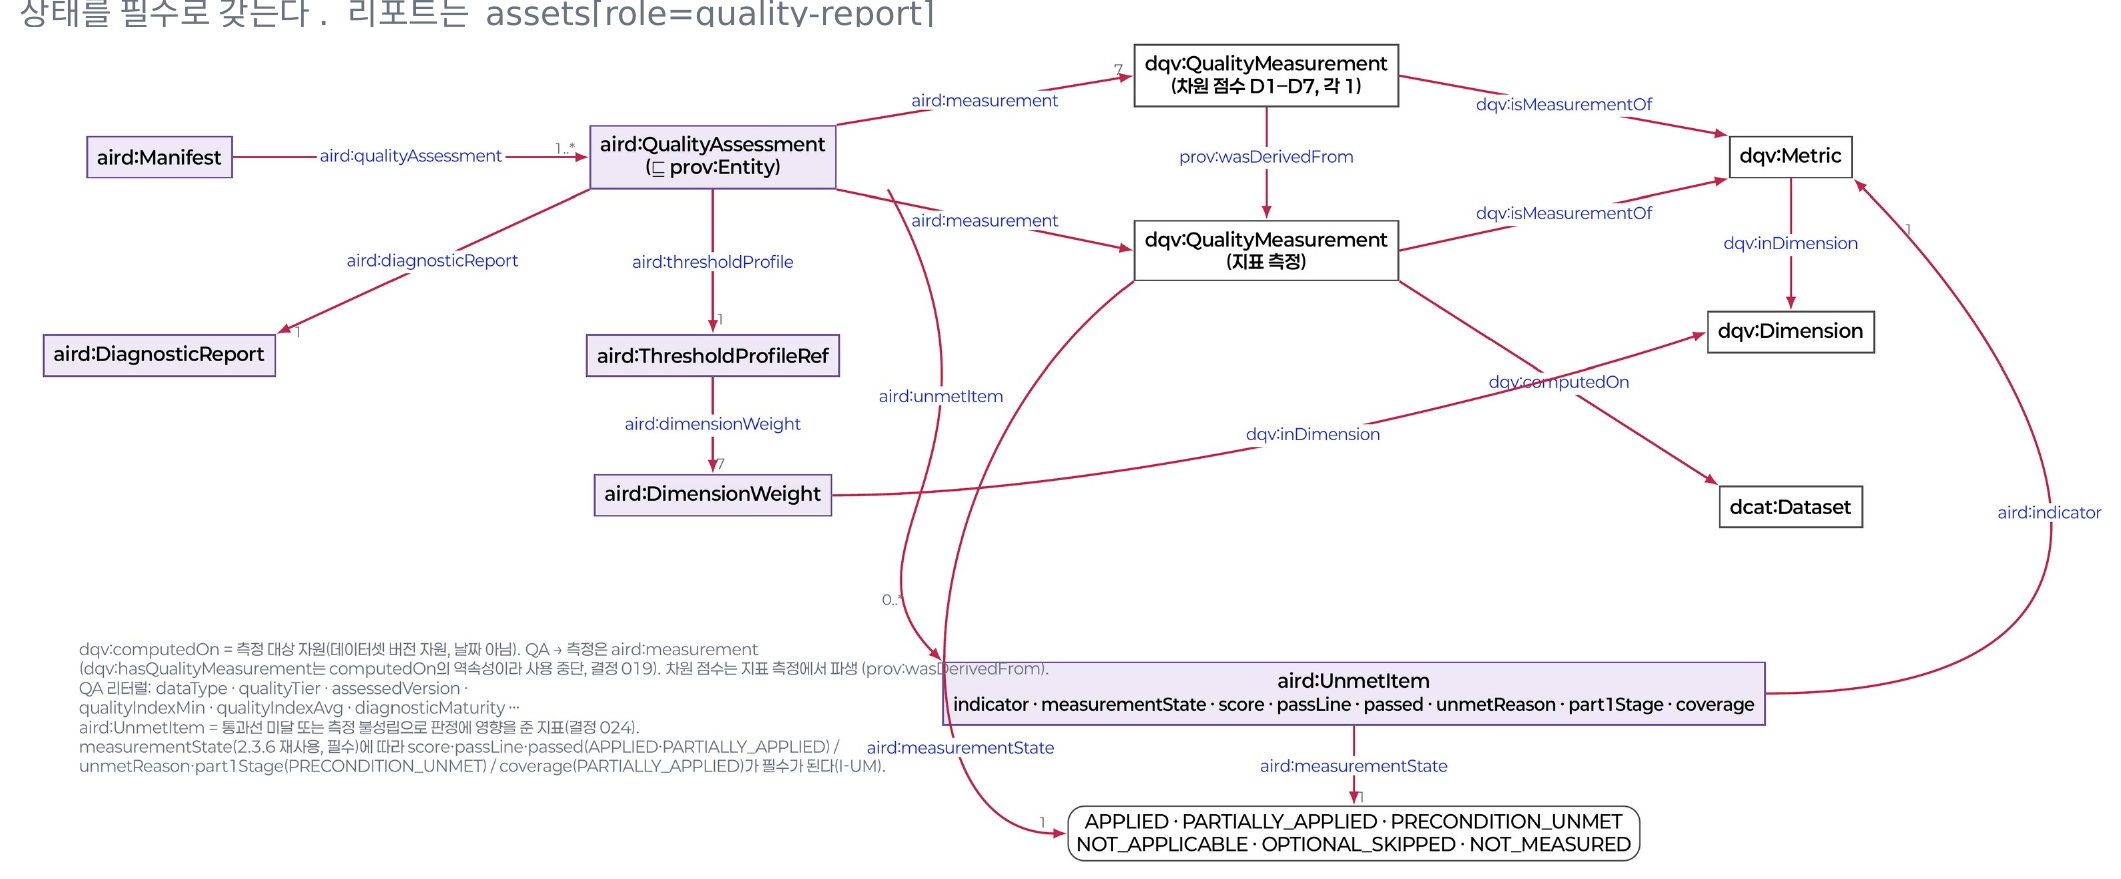
This page lists the metadata elements written in the manifest. The required discovery-layer metadata elements are the 23 in the demo profile of AIRD vocabulary v0.10.5 (19 for the dataset + 4 for each distribution): the 19 required in the deliberation draft (15 for the dataset + 4 for each distribution) plus 4 more.
The 4 added by the demo profile are dataset structure type · theme · landing page · maintaining department. Theme and landing page are required for public-sector data and recommended for other data. The deliberation draft and the vocabulary are consistent. The deliberation draft focuses on the required elements, while the vocabulary is the complete list, including external vocabularies. The discovery layer is written in stage 1 and the understanding layer in stage 2. If there are several distributions, the number of discovery-layer values is 19 + 4 × (number of distributions).
Discovery layer · 19 dataset elements Required
| # | Element | Property | Cardinality | Value range · criteria | Filled in by |
|---|---|---|---|---|---|
| 1 | Dataset identifier | dct:identifier | 1 | Persistent identifier URI · immutable | Organizational policy |
| 2 | Title | dct:title | 1 | String (@ko) | Data provider |
| 3 | Description | dct:description | 1 | String | Data provider |
| 4 | Keyword | dcat:keyword | 3..* | 3 or more | Data provider |
| 5 | Data service type | dct:type | 1 | Controlled vocabulary http://vocab.datahub.kr/def/dcat-ap-kr/service-type/ | Data provider |
| 6 | Dataset structure type | dct:type | 1 or more | Controlled vocabulary http://vocab.datahub.kr/def/aird/dataset-type/ | Data provider |
| 7 | Language | dct:language | 1 or more | Controlled vocabulary http://publications.europa.eu/resource/authority/language/ | Data provider |
| 8 | Lifecycle status | aird:lifecycleStatus | 1 | Controlled vocabulary http://vocab.datahub.kr/def/aird/lifecycle-status/ | Data provider |
| 9 | Theme Required · public sector (recommended otherwise) | dcat:theme | 1 | Controlled vocabulary http://vocab.datahub.kr/def/dcat-ap-kr/data-theme/ | Data provider |
| 10 | Landing page Required · public sector (recommended otherwise) | dcat:landingPage | 1 | URL of the dataset detail page | Data provider |
| 11 | Creator | dct:creator | 1 or more | URI or organization name | Data provider |
| 12 | Publisher | dct:publisher | 1 | URI or organization name | Data provider |
| 13 | Maintaining department | dcatkr:maintainer | 1 or more | Department name | Data provider |
| 14 | Contact point | dcat:contactPoint | 1 or more | Name and email | Data provider |
| 15 | Creation method | aird:creationMethod | 1 | Controlled vocabulary http://vocab.datahub.kr/def/aird/creation-method/ | Data provider |
| 16 | Update frequency | dct:accrualPeriodicity | 1 | Controlled vocabulary http://publications.europa.eu/resource/authority/frequency/ | Data provider |
| 17 | License | dct:license | 1 | Controlled vocabulary http://vocab.datahub.kr/def/dcat-ap-kr/license/ | Data provider |
| 18 | Rights | dct:rights | 1 | Notice of the scope of use | Data provider |
| 19 | Access rights | dct:accessRights | 1 | Controlled vocabulary http://publications.europa.eu/resource/authority/access-right/ | Data provider |
Discovery layer · 4 per distribution Required
If the data is distributed in several forms, describe each distribution (dcat:Distribution) separately.
| Element | Property | Value range | Filled in by |
|---|---|---|---|
| Access URL | dcat:accessURL | URI | Data provider |
| Media type | dcat:mediaType | IANA Media Type | Diagnostic tool |
| File format | dct:format | EU File Type code (e.g., CSV) | Data provider |
| Checksum | spdx:checksum | SHA-256 (computed from the file) | Diagnostic tool |
Conditionally required
| Element | Property | Condition |
|---|---|---|
| Column schema | csvw:tableSchema | Structured data |
| De-identification level | aird:deidentificationLevel | Contains personal data |
Understanding layer · key elements
Grouping and cardinalities follow vocabulary v0.10.5. Within a group such as the quality assessment (aird:QualityAssessment) or the decision gate record, “required” means required when that group is written. Elements the data provider fills in directly are shown in bold.
Version · history
| Element | Property | Vocabulary (number · obligation · cardinality) | Filled in by |
|---|---|---|---|
| Version number | dcat:version | 2.1.1 · required · 1..1 | Diagnostic tool |
| Issue date | dct:issued | 1.2.16 · conditionally required · Quality-Ready or higher · 0..1 | Diagnostic tool |
| Last modified date | dct:modified | 1.2.17 · conditionally required · Quality-Ready or higher · 0..1 | Diagnostic tool |
| Version notes | adms:versionNotes | 2.1.2 · required · 1..1 (per language) | Data provider |
| Previous version | dcat:previousVersion | 2.1.3 · conditionally required · rule A new version · 0..1 | Diagnostic tool |
Quality assessment — 2.2.1 conditionally required · lifecycleStatus = Quality-Ready
| Element | Property | Vocabulary (number · obligation · cardinality) | Filled in by |
|---|---|---|---|
| Data type | aird:dataType | 2.2.2 · required · 1..1 | Diagnostic tool |
| Quality tier | aird:qualityTier | 2.2.3 · required · 1..1 | Diagnostic tool |
| Minimum dimension score | aird:qualityIndexMin | 2.2.9 · required · 1..1 | Diagnostic tool |
| Weighted average | aird:qualityIndexAvg | 2.2.10 · required · 1..1 | Diagnostic tool |
| Minimum measurable indicator score | aird:qualityIndexMMI | 2.2.11 · conditionally required (at DM-0) · 0..1 | Diagnostic tool |
| Diagnostic Maturity | aird:diagnosticMaturity | 2.2.12 · conditionally required · 0..1 | Diagnostic tool |
| Transition eligibility | aird:qualityReadyEligible | 2.2.14 · conditionally required · when judging Quality-Ready · 0..1 | Diagnostic tool |
| Diagnosis time | prov:generatedAtTime | 2.2.15 · required · 1..1 | Diagnostic tool |
| Judgment rule version | aird:ruleVersion | 2.2.17 · required · 1..1 | Diagnostic tool |
| Schema version | aird:schemaVersion | 2.2.18 · required · 1..1 | Diagnostic tool |
| Diagnostic report | aird:diagnosticReport | 2.2.19 · required · 1..1 | Diagnostic tool |
| Threshold profile | aird:thresholdProfile | 2.2.20 · required · 1..1 | Diagnostic tool |
Dimension scores — 2.3.1 quality measurement · required · one each for D1–D7
| Element | Property | Filled in by |
|---|---|---|
| Completeness | dqv:QualityMeasurement · dimension D1 (Completeness) | Diagnostic tool |
| Consistency | dqv:QualityMeasurement · dimension D2 (Consistency) | Diagnostic tool |
| Accuracy | dqv:QualityMeasurement · dimension D3 (Accuracy) | Diagnostic tool |
| Timeliness | dqv:QualityMeasurement · dimension D4 (Timeliness) | Diagnostic tool |
| Validity | dqv:QualityMeasurement · dimension D5 (Validity) | Diagnostic tool |
| Uniqueness | dqv:QualityMeasurement · dimension D6 (Uniqueness) | Diagnostic tool |
| Machine readability | dqv:QualityMeasurement · dimension D7 (Machine readability) | Diagnostic tool |
Structural · semantic readiness
| Element | Property | Vocabulary (number · obligation · cardinality) | Filled in by |
|---|---|---|---|
| Feature completeness index | aird:featureCompletenessIndex | 2.4.1 · recommended · 0..1 | Diagnostic tool |
| Schema conformance rate | aird:schemaConformanceRate | 2.4.2 · recommended · 0..1 | Diagnostic tool |
| Label conformance rate | aird:labelConformanceRate | 2.4.3 · conditionally required · supervised learning · 0..1 | Diagnostic tool |
Trust · ethics
| Element | Property | Vocabulary (number · obligation · cardinality) | Filled in by |
|---|---|---|---|
| Known biases | rai:dataBiases | 2.5.1 · required · 1..* | Data provider |
| Known limitations | rai:dataLimitations | 2.5.2 · required · 1..* | Data provider |
| Missing data information | rai:dataCollectionMissingData | 2.5.3 · required · 1..1 | Data provider |
| Synthetic data flag | aird:isSynthetic | 2.5.9 · required · 1..1 | Data provider |
Provenance
| Element | Property | Vocabulary (number · obligation · cardinality) | Filled in by |
|---|---|---|---|
| Source data | prov:wasDerivedFrom | 2.6.1 · conditionally required · rule B derived dataset · 0..* | Data provider |
| Collection method | aird:collectionMethod | 1.2.12 · conditionally required · Quality-Ready or higher · 0..1 | Data provider |
| Preprocessing activity | prov:wasGeneratedBy | 2.6.2 · conditionally required · preprocessingLevel ≠ NONE or derived dataset: 1..*; otherwise 0..* · 0..* | Diagnostic tool |
| Transformation history | prov:wasGeneratedBy | 2.6.3 · conditionally required · purposeState = ready · 0..* | Diagnostic tool |
Decision gate judgment record
| Element | Property | Vocabulary (number · obligation · cardinality) | Filled in by |
|---|---|---|---|
| Gate type | aird:gateType | 2.7.2 · required · GD · 1..1 | Diagnostic tool |
| Gate result | aird:gateResult | 2.7.3 · required · GD · 1..1 | Diagnostic tool |
| Judgment time | prov:endedAtTime | 2.7.4 · required · GD · 1..1 | Diagnostic tool |
| Resulting status | aird:resultingStatus | 2.7.5 · conditionally required · G1·G2 PASS · 0..1 | Diagnostic tool |
Purpose readiness
| Element | Property | Vocabulary (number · obligation · cardinality) | Filled in by |
|---|---|---|---|
| Purpose readiness | aird:purposeReadiness | 2.8.1 · conditionally required · a purpose with purposeState = ready exists · 0..* | Diagnostic tool |
| Purpose assessment status | aird:purposeAssessmentStatus | 2.8.8 · conditionally required · an unjudged type exists · 0..* | Diagnostic tool |
Security · privacy
| Element | Property | Vocabulary (number · obligation · cardinality) | Filled in by |
|---|---|---|---|
| Contains personal data | aird:containsPersonalData | 2.9.1 · required · 1..1 | Data provider |
| Contains sensitive data | aird:containsSensitiveData | 2.9.3 · conditionally required · if it contains personal data · 0..1 | Data provider |
| De-identification level | aird:deidentificationLevel | 1.4.8 · conditionally required · contains personal data · 0..1 | Data provider |
Value lists
Values for the following elements are chosen from a fixed list and are not written as free strings.
| Element | Values | Source |
|---|---|---|
data_type | STRUCT · TEXT · IMAGE · TSERIES · PT | [Part 1 5.6 Table 5-5] |
metadata_status | Discoverable · Quality-Ready · Purpose-Ready · Stale | |
creation_method | collected collected · processed processed · synthetic synthetic · augmented augmented | |
access_rights | PUBLIC public · RESTRICTED restricted · NON_PUBLIC non-public | EU Publications Office · Access right authority table |
language | e.g., KOR Korean · ENG English | EU Publications Office · Language authority table |
media_type | e.g., text/csv · application/json · image/jpeg | IANA Media Types |
license | KOGL-0 · KOGL-1 · KOGL-2 · KOGL-3 · KOGL-4 · KOGL-AI · NO-RESTRICTION · CC-BY-4.0 · CC-BY-SA-4.0 · CC-BY-ND-4.0 · CC-BY-NC-4.0 · CC-BY-NC-SA-4.0 · CC-BY-NC-ND-4.0 · CC0-1.0 | vocabulary v0.10.5 1.4.1 · kr-license (DCAT-AP-KR integrated vocabulary · proposed) — reference vocabulary KOGL-THIRD-PARTY (includes third-party rights) is a rights status, not a license, so the vocabulary removed it from the dct:license values (deprecated) — state it in the dct:rights notice. The deliberation draft and the vocabulary are consistent. The deliberation draft focuses on the required elements, while the vocabulary is the complete list, including external vocabularies. Enterprise terms of use, MIT, Apache and similar licenses have no value in this list — extending the value space is a proposed revision of the vocabulary |
frequency | e.g., ANNUAL · ANNUAL_2 · QUARTERLY · MONTHLY · DAILY · IRREG | EU Publications Office · Frequency authority table |
Update frequency — data provider input and manifest value
| Data provider input | Manifest value |
|---|---|
| Updated once a year | http://publications.europa.eu/resource/authority/frequency/ANNUAL |
| Updated every six months | http://publications.europa.eu/resource/authority/frequency/ANNUAL_2 Being checked |
| Updated quarterly | http://publications.europa.eu/resource/authority/frequency/QUARTERLY |
| Updated once a month | http://publications.europa.eu/resource/authority/frequency/MONTHLY |
| Updated daily | http://publications.europa.eu/resource/authority/frequency/DAILY |
| As needed · irregular | http://publications.europa.eu/resource/authority/frequency/IRREG |
Other values
| Data provider input | Manifest value |
|---|---|
| KOGL Type 1 (Korea Open Government License) | KOGL-1 |
| CC BY 4.0 | CC-BY-4.0 |
| Enterprise terms of use (redistribution · automated collection restricted) | No value in the list — write the name and effective date of the terms in rights (dct:rights) Being checked |
| CSV file | text/csv |
| JSON file | application/json |
| Anyone can view | http://publications.europa.eu/resource/authority/access-right/PUBLIC |
| Approved organizations · contract customers only | http://publications.europa.eu/resource/authority/access-right/RESTRICTED |
| Data produced by survey or measurement | collected |
| Processed from existing data | processed |
| Korean | http://publications.europa.eu/resource/authority/language/KOR |
[Part 3 Annex A.1] [Part 3 Annex A.2] [Part 3 Annex C]
Quality indicators
Contents
ContentsThis page lists how the 16 formal quality indicators apply to each data type, with their preconditions and formulas. All scores range from 0 to 1. Weights and tier bands follow the threshold profile of the operating guideline.
Application by data type
● required formal · ○ optional · — not applicable. MMI is a minimum measurable indicator (an entry requirement for diagnosis).
| ID | Indicator | Dimension | STRUCT | TEXT | IMAGE | TSERIES | PT | |
|---|---|---|---|---|---|---|---|---|
D1-01 | Required field completeness | D1 Completeness | ● | ○ | ○ | ● | ● | |
D1-02 | Required metadata completeness | D1 Completeness | ● | ● | ● | ● | ● | |
D2-01 | Inter-field consistency | D2 Consistency | ● | — | — | ● | — | |
D2-02 | Referential integrity | D2 Consistency | ● | — | — | ● | — | |
D2-03 | Derived value accuracy | D2 Consistency | ● | — | — | ● | — | |
D3-01 | Standard name conformance | D3 Accuracy | ● | ○ | — | ○ | — | |
D3-02 | Label accuracy | D3 Accuracy | — | ○ | ● | — | ● | |
D4-01 | Currency | D4 Timeliness | ● | ● | ○ | ● | ● | |
D4-02 | Update fidelity | D4 Timeliness | ○ | ○ | — | — | ○ | |
D4-03 | Time series completeness | D4 Timeliness | — | — | — | ● | — | |
D5-01 | Format validity | D5 Validity | ● | ● | — | ● | ● | |
D5-02 | Numeric range validity | D5 Validity | ● | — | — | ● | — | |
D5-03 | Statistical plausibility | D5 Validity | MMI | ● | — | — | ● | — |
D6-01 | Uniqueness | D6 Uniqueness | MMI | ● | ○ | — | ● | ● |
D7-01 | Encoding consistency | D7 Machine readability | MMI | ● | ● | ○ | ● | ● |
D7-02 | Technical validity | D7 Machine readability | MMI | ● | ● | ● | ● | ● |
| Number of required formal indicators | 13 | 5 | 3 | 13 | 8 |
Preconditions and formulas by indicator
D1-01 Required field completeness — share of non-missing values in required columns
Precondition The list of required fields is defined in the column schema (csvw:tableSchema), in the metadata specification applied to the dataset, or in an equivalent document approved by the organization
Formula
(1 / |Freq|) × Σ_{f∈Freq} [ n(f ≠ NULL ∧ f ≠ '') / N ]Symbols Freq set of required fields · |Freq| number of required fields · N total number of records
D1-02 Required metadata completeness — share of required metadata elements filled in
Precondition The metadata specification applied to the dataset names the list of elements that serves as the denominator of this indicator. For a specification that does not name such a list, all required elements of that specification form the denominator
Formula
n(required metadata elements filled in) / n(all required metadata elements)D2-01 Inter-field consistency — compliance with relationship rules between two columns
Precondition The relationship rules are defined in one of the column schema (csvw:tableSchema), the metadata specification applied to the dataset, or an equivalent document approved by the organization
Formula
1 − ( n(records violating a rule) / N )D2-02 Referential integrity — whether code values appear in the code table
Precondition Values are checked against the actual values of the master code table. If only an address or reference exists and the values cannot be obtained, the judgment is precondition unmet (PRECONDITION_UNMET)
Formula
1 − ( n(unmapped code cells) / n(valid code cells) )Prerequisite indicator D5-01
D2-03 Derived value accuracy — whether stored derived values match the calculation rule
Precondition The calculation rule for derived values is defined in the schema, the column schema (csvw:tableSchema), or the metadata specification applied to the dataset. If there are no stored derived values, the judgment is not applicable (NOT_APPLICABLE)
Formula
1 − ( n(computed value ≠ stored value) / n(values checked) )D3-01 Standard name conformance — whether codes and names match the authoritative reference
Precondition An authoritative reference is available as a code-to-name mapping, and the data contains both codes and names
Formula
1 − ( n(code cells not matching the reference) / n(matched code cells) )Prerequisite indicator D2-02
D3-02 Label accuracy — share of labels matching the ground-truth labels
Precondition A set of ground-truth labels reviewed by experts exists. Automated measurement is not possible; the review results are used as input
Formula
n(matches) / n(items reviewed). For text and paired text, only an exact match counts as a matchD4-01 Currency — whether the data was updated within the stated update frequency
Precondition The update date and update frequency are recorded in the metadata
Formula
1.0 if days elapsed ≤ update interval. Otherwise max(0, 1 − (days elapsed − update interval) / grace period). The grace period equals the update interval in daysD4-02 Update fidelity — share of scheduled updates carried out
Precondition The update frequency and update history are stated in the metadata
Formula
n(updates carried out) / n(updates scheduled)D4-03 Time series completeness — whether time series measurement points are missing
Precondition The expected measurement points are stated in the metadata
Formula
n(actual measurement points) / n(expected measurement points)D5-01 Format validity — whether values follow the defined format
Precondition None. Columns without a defined format are excluded from measurement
Formula
1 − ( n(cells with format mismatch) / n(cells checked for format) )D5-02 Numeric range validity — whether numbers stay within the allowed range
Precondition An allowed range is defined for each column. If no column has a defined range, the judgment is precondition unmet (PRECONDITION_UNMET)
Formula
1 − ( n(out-of-range cells) / n(cells with a defined range) )D5-03 Statistical plausibility — whether dummy values or obviously wrong values are present
Precondition Dummy value patterns (indicator parameters in the threshold profile). Without an operating guideline, measurement is provisional using the example patterns in Part 2 Appendix I (Judgment procedure).
Formula
1 − ( n(cells with obviously wrong values) / n(numeric cells evaluated) )D6-01 Uniqueness — whether records are duplicated
Precondition None
Formula
n(unique keys) / N. If identifier columns are defined, duplicates of the same entity are measured; if not, the combination of all columns is used as the key and fully identical duplicate records are measuredD7-01 Encoding consistency — whether file encodings match the reference encoding
Precondition None
Formula
n(files using the reference encoding) / n(all files)D7-02 Technical validity — whether files open normally and have a valid structure
Precondition None
Formula
n(files that open normally ∧ meet the specification) / n(all files). A file meets the specification when parsing completes under the official specification of its file format and the required structure is validCalculation
| Value | Formula |
|---|---|
| Dimension score | Di = Σk (wk × Sk) / Σk wk |
| Minimum dimension score | min(Di) |
| Weighted average | Σi (Wi × Di) |
| Minimum measurable indicator score | Σ score(MMI) / n(MMI) |
| Weight redistribution | Wi′ = Wi / (1 − Wj) # Wj is the sum of the weights of the dimensions that could not be measured |
| Evaluation coverage | Σ statusFactor(applicable required formal indicators) / n(required formal indicators excluding NOT_APPLICABLE) |
Sk is the score of each required formal indicator for that data type whose measurement is complete. Optional indicators and incomplete indicators are excluded from both numerator and denominator. If a dimension has no completed formal indicator, Di is recorded as null. The weighted average is not used for tier judgment. Tier judgment starts from the minimum dimension score (Judgment procedure). Evaluation coverage is compared with the lower bound set in the operating guideline when judging Diagnostic Maturity DM-1.
Partial measurement
Indicators that allow partial measurement (PARTIALLY_APPLIED): D2-02 · D3-01 · D5-02. coverage = n(measurable targets) / n(identified measurement targets). Only targets that meet the precondition form the population. Targets that could not be measured are excluded from both numerator and denominator. The score is not multiplied by coverage again. If any measurement is partial, DM-2 cannot be reached. The upper limit of Diagnostic Maturity (DM) is DM-1.
Exclusivity — no double counting of the same defect across indicators
| Defect type | Responsible indicator |
|---|---|
| Format violation in a single field | D5-01 |
| Out-of-range value in a single field | D5-02 |
| Relationship violation between two fields | D2-01 |
| Mismatch in a calculation across multiple fields | D2-03 |
| Empty cell | D1-01 |
| Unmapped code | D2-02 |
Reference encoding
| Reference | Non-conforming | Not measured |
|---|---|---|
UTF-8 | EUC-KR · CP949 | Presence of a byte order mark · differences in line break characters |
[Part 2 Annex A.1–A.4] [Part 2 Annex B.1–B.6]
Status and judgment values
Contents
ContentsA list of the values used to record judgment results in the diagnostic report and the manifest. The standard’s three layers (diagnosis status · indicator applicability · Diagnostic Maturity (DM)) are the base layers; the display layer, which puts them into human-readable words, creates no new judgment.
Layers
| Layer | Question it answers | Normative | Clause |
|---|---|---|---|
| Diagnosis status | Can diagnosis begin? | Normative | [Part 2 Annex B.1 Table B.1] |
| Indicator applicability | Was the indicator measured, and if not, why? | Normative | [Part 2 Annex B.2 Table B.2] |
| Check result display | A single display value for the check result of each item (indicator · metadata element · requirement) | Display layer | — |
| Reasons for not judging | Why no judgment was made | Display layer (purpose tier reasons are standard codes) | [Part 3 Annex C.22] |
| Diagnostic Maturity judgment | How far the required indicators have been measured | Normative | [Part 2 Annex B.5 Table B.4] |
| Evaluation status | Is the evaluation final or provisional? | Normative | [Part 3 Annex C.20] |
| Decision gate judgment | Did the data pass the decision gate? | Normative | [Part 3 Annex C.21] |
Diagnosis status
| Value | Meaning |
|---|---|
DIAGNOSED | The diagnosis procedure was performed |
SCHEMA_ONLY | There are no records, so only the schema exists |
FILE_BROKEN | The file cannot be opened or its structure cannot be parsed |
For SCHEMA_ONLY and FILE_BROKEN, Diagnostic Maturity and the tier are recorded as null. SCHEMA_ONLY is resolved when the first instance is loaded.
Indicator applicability · normative contract
| Applicability | Meaning | Indicator score | statusFactor | Data provider action |
|---|---|---|---|---|
APPLIED | Measured | Score | 1 | None |
PARTIALLY_APPLIED | Only part of the targets measured | null | coverage | Obtain reference data for the remaining targets |
PRECONDITION_UNMET | Not measured because a precondition (such as reference data) is missing | null | 0 | Measure after obtaining the reference data |
NOT_APPLICABLE | Does not apply to this type or condition | null | Excluded from the calculation | None |
OPTIONAL_SKIPPED | An optional indicator was skipped | null | Excluded from the calculation | None |
The quality index and the tier judged with an operating guideline use only the APPLIED results of the applicable required formal indicators. Optional indicators are not included in the calculation even when they are measured and APPLIED. To judge a tier, all applicable required formal indicators must be APPLIED (Diagnostic Maturity DM-2).
Check result display
| Display | Meaning | Base layer mapping |
|---|---|---|
| Met | Measured or checked, and meets the criterion | APPLIED + criterion met |
| Not met | Measured or checked, but below the criterion | APPLIED + criterion not met |
| Not measured | Applicable but not yet measured | PRECONDITION_UNMET · PARTIALLY_APPLIED |
| Not applicable | Does not apply to the data type or purpose, or an optional indicator was skipped | NOT_APPLICABLE · OPTIONAL_SKIPPED |
| Not judged | The conditions needed for judgment are not met | Recorded together with the reason for not judging |
- A score of 0 means “measured and low”. Do not mix it up with not measured, not applicable or not judged.
- Not judging is different from judging and falling short. Do not record “Not judged” as the lowest tier or as not applicable.
- OPTIONAL_SKIPPED is displayed as “Not applicable”, with the skipped optional indicator recorded as the reason (not yet final).
Reasons for not judging
Display format: Not judged: <reason>
| Target | Reason | Meaning | Clause |
|---|---|---|---|
| Quality tier | No operating guideline applied | Scores exist, but no operating guideline has been applied to turn them into a tier | — |
| Quality tier | Below DM-2 | Diagnostic Maturity is not DM-2 | — |
| Purpose tier | PROFILE_NOT_REGISTERED purpose profile not registered | No profile has been registered for that use purpose | [Part 3 Annex C.22] |
| Purpose tier | THRESHOLD_NOT_PUBLISHED thresholds not published | A purpose profile exists, but its thresholds have not been published | [Part 3 Annex C.22] |
| Purpose tier | PRECONDITION_UNMET precondition not met | The conditions of the previous stage are not met | [Part 3 Annex C.22] |
The purpose tier code PRECONDITION_UNMET is the same code as PRECONDITION_UNMET in indicator applicability, but it applies to a different target.
Diagnostic Maturity display
| Decision table result | Display |
|---|---|
DM-2 | DM-2 |
DM-1 | DM-1 |
DM-0 | DM-0 |
null (row 5) | DM-0 not met |
null (row 1) | Not judged (diagnosis status exception) |
Each row of the decision table is in Judgment procedure.
Evaluation status and decision gate judgment
| Kind | Value | Meaning | Clause |
|---|---|---|---|
| Evaluation status | OFFICIAL | Evaluation that applies the OFFICIAL threshold profile of an operating guideline | [Part 3 Annex C.20] |
| Evaluation status | PROVISIONAL | Provisional evaluation (for example, D5-03 (Statistical plausibility) measured without an operating guideline using the example patterns of Part 2 Appendix I) | [Part 3 Annex C.20] |
| Decision gate judgment | PASS | The transition conditions of the decision gate (G1 · G2 · G3) are met | [Part 3 Annex C.21] |
| Decision gate judgment | FAIL | The transition conditions of the decision gate are not met | [Part 3 Annex C.21] |
Decision gates are defined in Part 1 5.2; the details of the judgment procedure are covered in Part 4. [Part 1 5.2 · Part 4]follow-on part
Manifest example
Contents
ContentsThis is the complete manifest of the example data (20 business registration records). It shows how discovery-layer and understanding-layer properties are written in JSON-LD.
The discovery layer reproduces the sample entry from the example file (meta.json). Only the identifiers were replaced with this site’s example identifiers. With a single manifest, an agent starts the four judgments (fitness · reliability · joinability · usability). How to assemble and distribute a pack is described in Packaging and distribution.
Properties read for each judgment
| Judgment | Properties read in this manifest |
|---|---|
| Fitness | dct:description · csvw:tableSchema · dct:type |
| Reliability | aird:lifecycleStatus · dct:accrualPeriodicity · spdx:checksum |
| Joinability | dct:identifier · csvw:tableSchema |
| Usability | dct:license · dct:rights · dct:accessRights |
Discovery layer — a manifest that has completed stage 1
All 23 required discovery-layer metadata elements and the column schema (csvw:tableSchema) are filled in. The checksum is the actual SHA-256 of example.csv. This example uses a simplified notation that merges the manifest and the dataset into one node. The standard gives the dataset (the resource) and the manifest (the description document) separate identifiers; the separated structure appears in the manifest excerpt in Packaging and distribution — files needed for each readiness state.
{
  "@context": [
    "https://datahub.kr/ns/aird-context-3.0.jsonld",
    {
      "dct": "http://purl.org/dc/terms/",
      "dcat": "http://www.w3.org/ns/dcat#",
      "aird": "http://vocab.datahub.kr/def/aird/",
      "aird-ml": "http://vocab.datahub.kr/def/aird-ml/",
      "aird-kg": "http://vocab.datahub.kr/def/aird-kg/",
      "csvw": "http://www.w3.org/ns/csvw#",
      "dqv": "http://www.w3.org/ns/dqv#",
      "prov": "http://www.w3.org/ns/prov#",
      "spdx": "http://spdx.org/rdf/terms#",
      "adms": "http://www.w3.org/ns/adms#",
      "vcard": "http://www.w3.org/2006/vcard/ns#",
      "rai": "http://mlcommons.org/croissant/RAI/",
      "dpv": "https://w3id.org/dpv#",
      "cr": "http://mlcommons.org/croissant/",
      "sc": "https://schema.org/",
      "void": "http://rdfs.org/ns/void#",
      "dcatkr": "http://vocab.datahub.kr/def/dcat-ap-kr/",
      "foaf": "http://xmlns.com/foaf/0.1/"
    }
  ],
  "@id": "https://data.example.go.kr/id/dataset/biz-registry/manifest/1.0.0",
  "@type": "dcat:Dataset",
  "aird:lifecycleStatus": "http://vocab.datahub.kr/def/aird/lifecycle-status/Discoverable",
  "dct:identifier": "https://data.example.go.kr/id/dataset/biz-registry",
  "dct:title": "예시 사업장 등록 정보",
  "dct:description": "지역별 사업장의 등록 정보와 영업 상태를 수록한 예시 데이터셋이다. 이 표준의 적용 절차를 보이기 위하여 작성하였다.",
  "dcat:keyword": [
    "사업장",
    "산업분류",
    "지역",
    "영업상태"
  ],
  "dct:type": [
    "http://vocab.datahub.kr/def/dcat-ap-kr/service-type/FILE",
    "http://vocab.datahub.kr/def/aird/dataset-type/Structured"
  ],
  "dct:language": [
    "http://publications.europa.eu/resource/authority/language/KOR"
  ],
  "csvw:tableSchema": {
    "columns": [
      {
        "name": "bizId",
        "datatype": "string",
        "dc:description": "사업장 고유 등록번호. B-YYYY-NNNN 형식",
        "required": true
      },
      {
        "name": "bizName",
        "datatype": "string",
        "dc:description": "사업장 명칭"
      },
      {
        "name": "industryCode",
        "datatype": "string",
        "dc:description": "한국표준산업분류 세세분류 코드"
      },
      {
        "name": "regionCode",
        "datatype": "string",
        "dc:description": "행정표준코드 법정동 시군구 코드"
      },
      {
        "name": "employeeCount",
        "datatype": "integer",
        "dc:description": "상시 종업원 수. 0 이상 100000 이하"
      },
      {
        "name": "revenueBand",
        "datatype": "string",
        "dc:description": "매출 구간 코드. B1부터 B4까지"
      },
      {
        "name": "registeredOn",
        "datatype": "date",
        "dc:description": "최초 등록일. ISO 8601-1 날짜"
      },
      {
        "name": "closedFlag",
        "datatype": "integer",
        "dc:description": "폐업 여부. 0은 영업, 1은 폐업"
      }
    ],
    "primaryKey": "bizId"
  },
  "dct:creator": [
    "https://data.example.go.kr/org/example-agency"
  ],
  "dct:publisher": "https://data.example.go.kr/org/example-agency",
  "dcat:contactPoint": {
    "@type": "vcard:Contact",
    "vcard:fn": "예시기관 데이터관리팀",
    "vcard:hasEmail": "mailto:data@example.go.kr"
  },
  "aird:creationMethod": "http://vocab.datahub.kr/def/aird/creation-method/collected",
  "dct:accrualPeriodicity": "http://publications.europa.eu/resource/authority/frequency/ANNUAL",
  "dct:license": "http://vocab.datahub.kr/def/dcat-ap-kr/license/KOGL-1",
  "dct:rights": "공공누리 제1유형. 출처를 표시하면 상업적 이용과 변형을 허용한다.",
  "dct:accessRights": "http://publications.europa.eu/resource/authority/access-right/PUBLIC",
  "dcat:distribution": [
    {
      "@type": "dcat:Distribution",
      "dcat:accessURL": "https://data.example.go.kr/aird/example-registry/data/example.csv",
      "dcat:mediaType": "text/csv",
      "dct:format": "http://publications.europa.eu/resource/authority/file-type/CSV",
      "spdx:checksum": {
        "spdx:algorithm": "SHA-256",
        "spdx:checksumValue": "7ad8add25d7a638322dd869f08b2fc7d64a4b12a3755c58ca9a10ee8646d78ea"
      }
    }
  ],
  "dcat:theme": [
    "http://vocab.datahub.kr/def/dcat-ap-kr/data-theme/INDUSTRY_EMPLOYMENT"
  ],
  "dcat:landingPage": "https://data.example.go.kr/dataset/biz-registry",
  "dcatkr:maintainer": {
    "@type": "foaf:Agent",
    "foaf:name": "예시기관 데이터관리팀"
  }
}
The column descriptions use dc:description on the assumption that an external context declares the dc prefix. The local context of this document does not contain that declaration. Being checked
Understanding layer — what stage 2 adds Example
This example records the measurement results for the same data as understanding-layer properties. No operating guideline was applied in this example. Therefore the quality tier (aird:qualityTier) and the threshold profile (aird:thresholdProfile) are empty. Empty values are a normal result. An agent interprets them not as a score of 0 but as “not judged: no operating guideline applied”.
D5-03 (Statistical plausibility) was measured provisionally with the example patterns in Part 2 Appendix I. Therefore the Diagnostic Maturity (DM) is DM-0 (provisional). The procedure that determines Diagnostic Maturity is described in Judgment procedure. Property names will follow the schema that the standard publishes once it is finalized.
{
  "@id": "https://data.example.go.kr/id/dataset/biz-registry/manifest/1.1.0",
  "dcat:previousVersion": "https://data.example.go.kr/id/dataset/biz-registry/manifest/1.0.0",
  "aird:lifecycleStatus": "http://vocab.datahub.kr/def/aird/lifecycle-status/Discoverable",
  "aird:dataType": "STRUCT",
  "dqv:computedOn": "https://data.example.go.kr/id/dataset/biz-registry",
  "prov:generatedAtTime": "2026-09-03",
  "aird:completenessScore": 1.0,
  "aird:validityScore": 1.0,
  "aird:uniquenessScore": 1.0,
  "aird:machineReadabilityScore": 1.0,
  "aird:diagnosticMaturity": "DM-0",
  "aird:qualityTier": null,
  "aird:thresholdProfile": null,
  "aird:diagnosticReport": {
    "@id": "https://data.example.go.kr/id/dataset/biz-registry/report/2026-09-03",
    "spdx:checksum": {
      "spdx:algorithm": "SHA-256",
      "spdx:checksumValue": "(SHA-256 of the diagnostic report file)"
    }
  },
  "rai:dataLimitations": [
    "폐업 신고 지연으로 closedFlag의 반영 시점이 실제 폐업 시점보다 늦을 수 있다"
  ]
}
The dimension scores (aird:completenessScore and so on) are a shortened notation for readability. AIRD vocabulary v0.10.5 records dimension scores as quality measurements (dqv:QualityMeasurement, 2.3.1 — one each for D1–D7). Being checked
One verified fact Example Proposed
This example records one fact confirmed by diagnosis as one measurement. It follows the DQV vocabulary that the standard already uses. aird:targetColumn · aird:referenceStandard · aird:validUntil are proposed properties.
{
  "@type": "dqv:QualityMeasurement",
  "dqv:isMeasurementOf": "aird:D2-02",
  "dqv:computedOn": "https://data.example.go.kr/id/dataset/biz-registry",
  "prov:generatedAtTime": "2026-09-03",
  "dqv:value": 0.997,
  "aird:targetColumn": "regionCode",
  "aird:referenceStandard": "행정표준코드 법정동 (버전 명시)",
  "aird:validUntil": "2026-12-03"
}
How to read these properties is described in Fields and handling by judgment, and the list of properties in Metadata elements. The release status of the schema and context is in Development status and upcoming releases.
The whole pack as one RDF graph
Merging the pack’s JSON-LD files (manifest · column schema · operation file · decision gate judgments) into one RDF graph reveals the references that cross file boundaries. The contents of each file are described in Packaging and distribution — files needed for each readiness state.
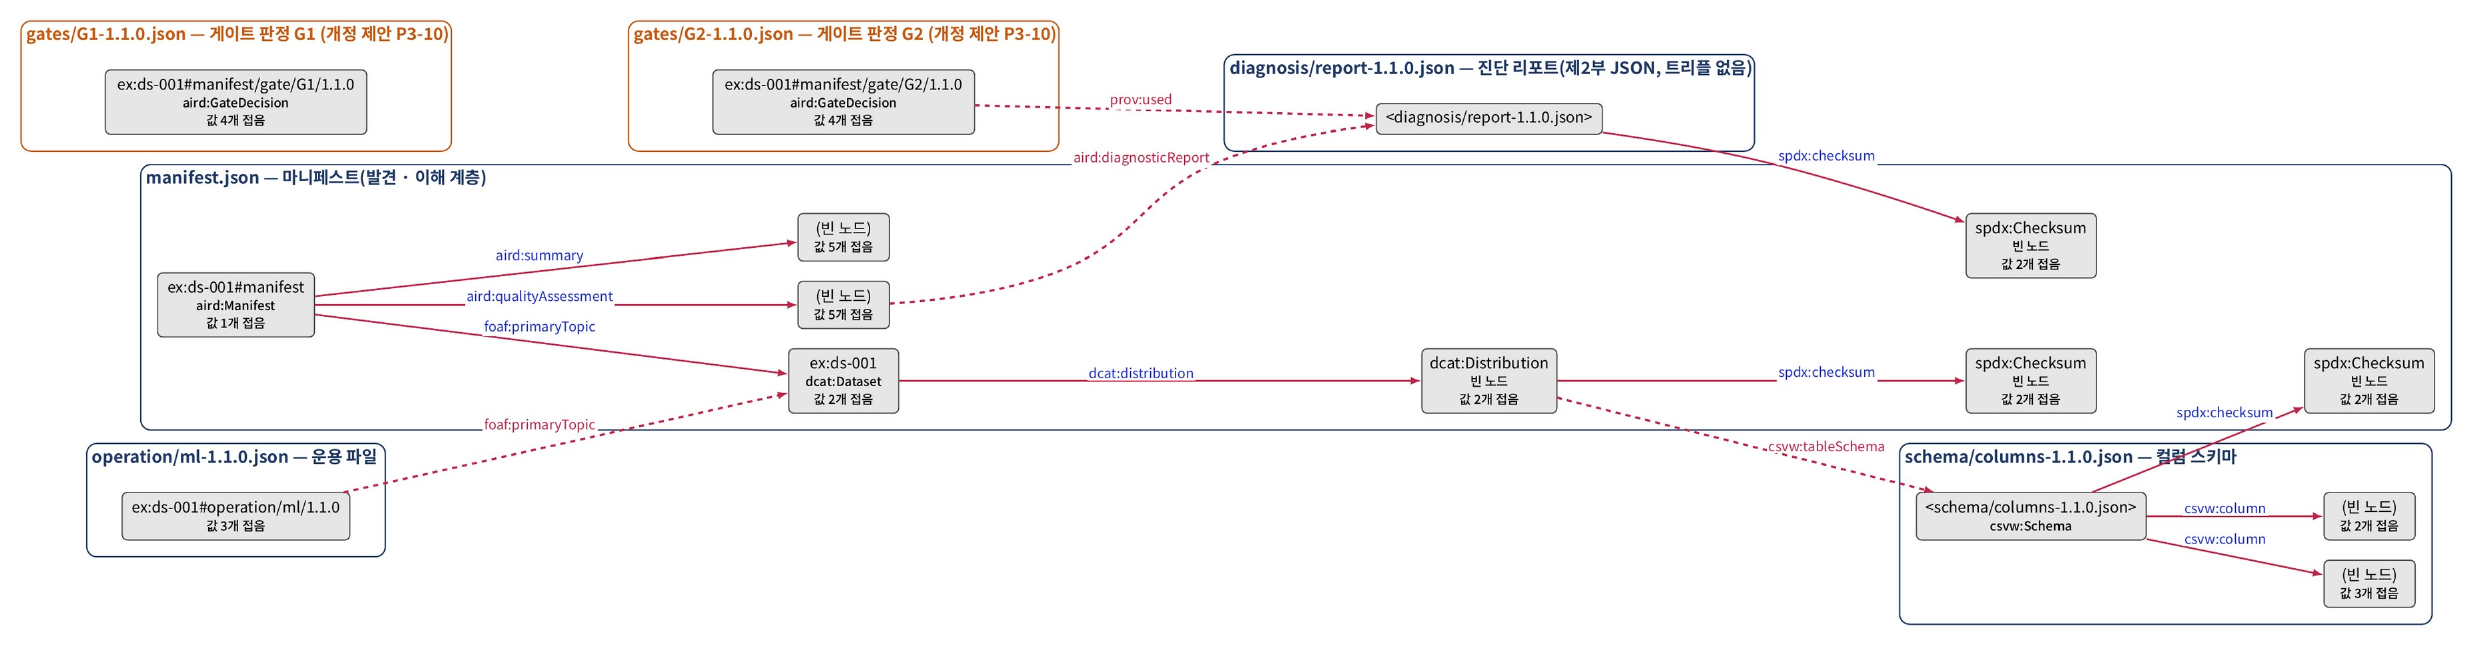
Public tools
This page describes the features, limitations and repositories of two tools that apply the AI-Ready Data draft standard and that you can download or connect to today.
Both tools are available from public repositories. Tools still in development are listed in Development status and upcoming releases.
Public Data Lens (public-data-lens)
Public Data Lens is an MCP server that applies the draft standard to the catalog metadata of the Korea Public Data Portal (data.go.kr). When an agent queries with a use purpose, the server searches for relevant data. The server judges the completeness and timeliness of the catalog metadata and measures minimum measurable indicators (MMI) at the catalog level. It returns results together with the grounds for each judgment. These judgments are not quality measurements or tier judgments of the data itself.
| Item | Details |
|---|---|
| Kind | MCP server |
| Main users | Agent and AI developers (data users) |
| Status | Beta (v1.1) |
| Features | Search · single-record lookup · comparison · monthly change tracking · catalog statistics · column structure of file data · observation of sample values · drafting a data-use plan |
| Judgment and interpretation | Judgment: performed by the server under versioned rules (reproducible) · Purpose-specific interpretation: performed by the agent |
| Data | Monthly snapshot of the full Korea Public Data Portal catalog (the observations in Why it is needed cover only the file data catalog) — 96,110 entries in the 2026-07 snapshot (checked 2026-10-05) |
| Limitations | Based on catalog metadata. No guarantee of the content, quality or joinability of the actual data |
| Repository | github.com/hike-lab/public-data-lens · MIT |
| Related pages | Fields and handling by judgment · Metadata elements |
Catalog converter (aird-tools · catalog-converter)
The catalog converter is the tool currently usable from aird-tools, the collection of implementation tools released during development of the standard. The converter converts catalog metadata into the metadata format of the standard.
| Item | Details |
|---|---|
| Kind | Conversion tool |
| Main users | Data providers |
| Status | v0.1 |
| Features | Catalog metadata conversion |
| Judgment and interpretation | No judgment (format conversion only). Usage and input formats are described in the repository |
| Limitations | Early version. The manifest validator, quality evaluator and conversion pipeline are in development (Development status and upcoming releases) |
| Repository | github.com/hike-lab/aird-tools · MIT |
| Related pages | Metadata elements |
Tool information was checked on 2026-10-05.
About this site
This page explains what this site covers and does not cover, its menus, publication information and the status of its content.
This site is a public site that explains Parts 1–3 and the follow-on parts (Parts 4–5) of the TTA (Telecommunications Technology Association) “AI-Ready Data” draft standard (TTAK deliberation draft v0.95). The site explains the requirements and judgment methods of the standard and provides application guides · tools · observational evidence. It is operated by the HIKE Lab, Chung-Ang University.
Four components of the site
| Layer | Contents | Location on the site |
|---|---|---|
| Standard | Requirements and the tier system. Normative documents. Judgment criteria are set by the operating guideline, a document separate from the standard | Clause markers [Part 2 8.1] · The standard and operating guidelines · Building an operating guideline |
| Explanation · guides | Background of the requirements and application procedures. Does not create new requirements | What is AI-ready data · Preparing data · For agents · Concepts and judgment menus · Recommended marker |
| Tools | Public tools (MCP server · conversion tools) · how to read the diagnostic report · machine-readable data | Public tools · Reading the diagnostic report |
| Evidence | Observations · run logs · experiments. Methods and limitations are stated with them | Measured · run log · illustrative example markers |
Site menus
| Menu | Contents |
|---|---|
| About the standard | Definition of AI-ready data · why it is needed · case videos · the standard and operating guidelines · origins and progress · development status and upcoming releases |
| Preparing data | The data provider’s preparation procedure (stages 1–3) · persistent identifiers · reading the diagnostic report · packaging and distribution · example data and public data examples · FAQ |
| For agents | What agents read from the manifest · fields and handling by judgment |
| Operating guidelines | Adoption brief · building an operating guideline · items set by the operating guideline · tier simulation |
| Concepts and judgment | Key concepts · design rationale · judgment procedure · related standards · effect study |
| Reference | Glossary · metadata elements · full vocabulary · quality indicators · status and judgment values · use purposes and automated-use conditions · judgment cases · crosswalk (DCAT-AP-KR · portal) · manifest example · machine-readable data · public tools |
Publication information
| Item | Details |
|---|---|
| Operator | HIKE Lab, Chung-Ang University |
| Standard | AI-Ready Data draft standard (Parts 1–3) · standard number not yet assigned |
| Establishment scope | The December 2026 establishment scope is Parts 1–3. Parts 4 and 5 are follow-on parts. |
| Vocabulary | AIRD vocabulary (v0.10.5) (reference vocabulary) |
| Content license | CC BY 4.0 |
| Public address | https://aird.datahub.kr |
| Error reports | hike.cau@gmail.com |
Status of the site
The content of this site is not an obligation under laws or regulations. This site does not create new requirements. The governing standard is the TTA “AI-Ready Data” Parts 1–3 draft standard. The follow-on parts (Parts 4–5) are a scope adopted in the standard discussions, and only explanations are provided for them. The explanations apply equally to data from public institutions · companies · non-profit organizations. This English version is an unofficial explanatory translation of the Korean site.
Parts 1–3 are within the December 2026 establishment scope. If requirements or identifiers change in the established standard, this site is updated accordingly.
Scope of the site
| Item | Details |
|---|---|
| In scope | Checks · presenting metadata elements · showing the evidence and judgment criteria for each element · presenting error cases and correction cases · explaining how to interpret the diagnostic report |
| Out of scope | Imposing new obligations · deciding judgment criteria (set by the guideline publisher) · evaluating specific organizations · datasets · ranking organizations · receiving files and diagnosing them (a distributable version of the diagnostic tool is in development) |
Materials in preparation are in Development status and upcoming releases, and how the standard was created is in Origins and progress.
Usage statistics
This site uses Google Analytics 4 to understand how it is used and to improve its content.
| Item | Details |
|---|---|
| Collected | Address and title of pages visited · time on page · scrolling · outbound links · file downloads · video plays · whether widgets and search are used · referral source · approximate location (country · city) · browser and device type |
| Not collected | Information that identifies a person, such as name or email · search terms · values entered or selected in widgets. Google Analytics 4 does not store IP addresses. |
| Features not used | Google signals · ads personalization · linking to advertising accounts |
| Retention | Event data: 2 months |
| Opting out | Use your browser’s tracking protection or the Google Analytics opt-out browser add-on. Opting out does not affect use of the site. |